Personal Wealth Management / Economics
‘Too Few Goods’—the Simple Explanation for October’s Elevated Inflation Rates
This, too, shall pass.

Breathe. Yes, the US Consumer Price Index (CPI) inflation rate hit a 30-year high, 6.2% y/y, in October.[i] Yes, this is a big jump from September’s 5.4%.[ii] But no, it doesn’t mean that dogged, persistent inflation is here to stay. It doesn’t mean a wall of easy money has thrown the economy out of balance. Rather, it is a symptom of a reality we have all lived through the past 20 months: It is far, far easier for a government to suddenly stop economic activity via lockdown than for businesses to restart it once regulations permit. Stocks have long understood this, even if it is only just starting to dawn on the world at large.
The sudden halt and choppy restart of the global economy explains much of prices’ trajectory since early 2020, in our view. First lockdowns shattered production and demand, sending prices tumbling. That created a low year-over-year comparison point this spring, when vaccines’ rollout enabled broader reopening, juicing demand. That added skew to the year-over-year inflation rate, making the month-over-month rate a better place to look when assessing inflation’s drivers. The biggest contributors to month-over-month rates this spring and summer were categories tied most to reopening, including hotels, airlines and used cars—which were in short supply after rental car companies rebuilt their fleets in a hurry.
But as summer rolled into autumn, some reopening-related pressures faded, as Exhibit 1 shows, and new pressures appeared in their wake. Many stemmed from supply shortages, which in turn stemmed from labor shortages and global shipping hangups. These are perhaps most visible in accelerating food and vehicle prices. Owners’ equivalent rent is another recent driver—an imaginary cost that no one pays, as it is the hypothetical amount a homeowner would pay to rent their own house. It rises alongside home prices, making it useless even as a proxy for households’ mortgage payments, the vast majority of which are fixed. The other recent big contributor is energy prices—namely oil and gas prices—which jumped when global demand surged as coal and natural gas prices spiked and utilities needed an alternate power source in a hurry. In October, energy alone accounted for over one-third of CPI’s 0.9% m/m rise.[iii]
Exhibit 1: Inflation Pressures’ Shift From Reopening to Shortages
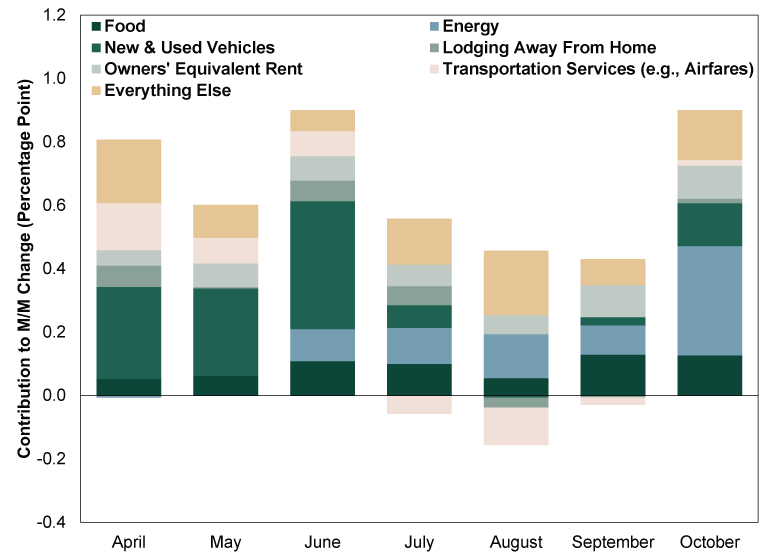
Source: US Bureau of Labor Statistics, as of 11/10/2021.
As Nobel laureate Milton Friedman taught, inflation is always and everywhere a monetary phenomenon—too much money chasing too few goods. When assessing inflation, we find it helpful to break that last clause into its three parts: too much money, chasing and too few goods. M2 money supply surged last year as the Fed pumped out liquidity to replace businesses’ lost sales and households’ lost paychecks. But bank reserves account for nearly half of the cumulative increase since 2020 began, and the vast majority seem to be excess reserves sitting on deposit at Federal Reserve banks and not backing loans.[iv] Excluding bank reserves, M2 money supply is now growing more slowly than it did for most of 2015 – 2019, when inflation was mostly below the Fed’s 2% y/y target, much to policymakers’ chagrin. Weak lending also suggests money isn’t doing much “chasing,” a notion underscored by the historically low velocity of money.[v] US personal consumption expenditures—the broadest measure of household spending—have already slowed from a reopening resurgence to rates more akin to the pre-pandemic norm and surveys show many households used stimulus money to repay debt or build savings they may not spend at all. It doesn’t look like there is a mountain of household liquidity waiting to do more chasing from here.
That leaves the “too few goods” part of Friedman’s statement to assess. Supply is quite short in several areas—a testament to the impossibility of managing the economy from the top down. Governments can easily put the economy into a medically induced coma at the drop of a hat. Shutting down is all too easy. But restarting is another matter, especially outside the laptop work-from-home world. When businesses were forced to shut or operate at minimum capacity for months, they had to cut overhead to survive. That meant furloughing or laying off workers, shutting facilities and running down inventories. Especially when you don’t know how long lockdowns will last. This occurred all up and down the supply chain. You can’t undo that overnight.
Rebuilding a staff takes time and money. So does increasing production to meet resurgent demand. A farmer that beefs up its cattle herds[vi] today in response to high meat prices won’t be able to meaningfully increase beef supply for a year at least, depending on the age and breed of cow. A wholesaler that sold off a warehouse to make ends meet last year can’t immediately get that space back. Similarly, it can take months for new oil well drilling to translate to new gasoline flowing out of refineries. Extrapolate these headaches across the entire universe of physical goods and energy commodities, and you end up with a choppy recovery in output that trails the recovery in demand. In other words, exactly what the world has lived through in recent months.
Encouragingly, there are strong indications that this situation will even out sooner than later, particularly on the energy side. We have written before on spiking energy prices’ myriad causes and won’t rehash that here, but the effects are waning. Benchmark European natural gas prices are down -40.6% from October’s peak.[vii] European wind power generation is up. Chinese thermal coal prices are down -52.7% and back at pre-spike norms.[viii] Combined, these developments should help reduce the demand for oil, which power providers had turned to as an emergency electricity source. Meanwhile, US oil rig count is up from 172 in mid-August 2020 to 450 as of last Friday, and domestic production rose to 11.5 million barrels per day last week, matching its year-to-date high.[ix] That should rise further as more rigs come online. Crude inventories have also risen in recent weeks. As a result, the US Energy Information Administration projects oil prices will peak this month as supply and demand come back into balance, then drift lower over the foreseeable future.[x] While the EIA’s forecast could be wrong, it seems to be rooted in a sound look at fundamentals, in our view.
Rising supply doesn’t mean CPI will fall. But it does mean that the big month-over-month increases should soon become a thing of the past, with prices growing more slowly off a higher base. That isn’t pleasant, but it is the normal course of things when price increases work their way through the economy. The mechanics of this are as old as economics itself and not at all a surprise to stocks, which know how the plumbing works. You don’t have to call that “transitory” inflation if you don’t want to, but it is the technical definition of that particular word.
[i] Source: US Bureau of Labor Statistics, as of 11/10/2021.
[ii] Ibid.
[iii] Ibid.
[iv] The Fed ceased publishing its measure of excess reserves in September 2020. But until then, excess and total reserves were moving in tandem. Considering lending hasn’t soared since then, we consider this statement about excess reserves’ dominance to be a fair deduction.
[v] Source: Federal Reserve Bank of St. Louis, as of 11/10/2021. Statement based on the velocity of M2 money supply.
[vi] Pun intended.
[vii] Source: FactSet, as of 11/10/2021. Dutch TTF Gas Price in EUR, 10/6/2021 – 11/10/2021.
[viii] Ibid. China Thermal Coal Price in CNY, 10/20/2021 – 11/10/2021.
[ix] Source: FactSet and US EIA, as of 11/10/2021.
[x] “This Week in Petroleum,” US EIA, 11/10/2021.
If you would like to contact the editors responsible for this article, please message MarketMinder directly.
*The content contained in this article represents only the opinions and viewpoints of the Fisher Investments editorial staff.
Get a weekly roundup of our market insights
Sign up for our weekly e-mail newsletter.

You Imagine Your Future. We Help You Get There.
Are you ready to start your journey to a better financial future?

Where Might the Market Go Next?
Confidently tackle the market’s ups and downs with independent research and analysis that tells you where we think stocks are headed—and why.
Related Resources
-
Expert Commentary Why Ken Fisher Is Optimistic About European Stocks
 2026-07-23
 -
Economics A Summertime Check-in on US Consumers2026-07-23
-
Market Analysis Why the SOX “Bear Market” Isn’t Foreboding2026-07-21
-
Politics Blunting Burnham?2026-07-21


Learn More
Learn why 210,000 clients trust us to manage their money and how Fisher Investments and its affiliates may be able to help you achieve your financial goals.
As of 6/30/2026
New to Fisher? Call Us.
Contact Us Today