


Personal Wealth Management / Market Volatility
Understanding Market Volatility
Volatility refers to how much the price of a security or broader market index moves over time—up or down. Volatility is normal within financial markets and an unavoidable aspect of investing in stocks.
Key Takeaways:
- While many investors associate market volatility with negative returns, volatility can occur upwards or downwards.
- Historical volatility is not predictive of future returns or volatility.
- Negative stock market volatility can include pullbacks, corrections and bear markets—but increased negative volatility does not necessarily indicate a bear market is on the horizon.
- A long-term investing strategy will generally involve the need to endure periods of volatility.
Few things worry stock market investors more than market volatility. Consider the financial media’s sensationalism when covering market pullbacks and corrections. Given these narratives, it is understandable why investors are fearful of volatility. However, market volatility does not always mean negative returns—volatility can occur upwards too. Despite its often negative stigma, volatility is part and parcel to investing in stocks and enduring equity-like volatility is the price investors typically pay to capture the long-term growth that stocks can provide.
In this article, we’ll explain what volatility is, the causes behind market volatility, whether stocks are more volatile than bonds and how volatility could impact your investment portfolio.
What Is Market Volatility?
In Fisher Investments’ experience, short-term market volatility is impossible to consistently predict. Sometimes, volatility may strike for no clear reason, while other times the cause may become more clear in hindsight. Some common causes can include:
- Surprises in economic data, including things like growth, inflation, jobs reports or consumer spending trends
- Interest rates and monetary policy expectations, including changes in how investors view Federal Reserve policy
- Geopolitical events, elections or policy uncertainty that may change market expectations
- Investor sentiment and market sentiment shifting quickly after news or price movement
- Company-specific issues that affect an individual stock or a narrow group of stocks
Because markets move most on the gap between expectations and reality, the same news can have different effects depending on what investors and other market participants have already priced in (or expected). Investors may react quickly to any surprise, positive or negative, which can add to short-term volatility.
Is Volatility Good or Bad?
It is natural to fear volatility, as times of uncertainty and change can be extremely challenging. However, volatility is often unpredictable and can be short-lived. Importantly for investors, volatility in markets is not predictive, and trying to time portfolio trades to sidestep short-term volatility is not necessary—and can actually prove costly.
While exiting stocks when volatility strikes may feel like an emotional relief, inadvertently missing big positive days in the market can cause your cumulative returns over time to drop sharply. For example, if you only missed the 10 best trading days from 1988 through 2025, your cumulative returns would have been cut in half compared to if you had stayed fully invested in the market during that entire period.[i] Many of the best days (good volatility) occur around bear markets and corrections, which highlights the danger of reacting to steep market downturns and elevated volatility.
Learn more about how we help investors navigate market volatility.
Request an Appointment
How Market Volatility Is Measured
Volatility is commonly expressed as variability in returns or price swings over time. One way to measure historical volatility is standard deviation, which shows how much returns have fluctuated around their average over a specific period. A higher standard deviation generally indicates greater statistical volatility, while a lower standard deviation indicates returns have varied less over the measured period.
Investors and traders also often cite the Cboe Volatility Index, or VIX. This volatility index uses options prices to estimate expected volatility for the S&P 500 over the next 30 days. Because it is derived from options prices, the VIX is a form of implied volatility rather than historical volatility.
The VIX can provide context about projected volatility, risk and US stock market expectations, but it is tied to the S&P 500 and does not measure every financial market. Like standard deviation, implied volatility is a tool for context, not a forecast, and in Fisher Investments’ view, fixating on things like the VIX and short-term movements in general can be counterproductive for long-term investors.
In terms of negative stock market declines, there are three distinct types. They are pullbacks, corrections and bear markets. Pullbacks are smaller, sentiment-driven declines typically between 5% and 10%, while corrections are often roughly 10% to 20% declines. Corrections tend to be sharp and steep, and are also sentiment-driven events. Finally, bear markets are deeper, more fundamentally driven declines of approximately 20% or greater from all-time highs. Unlike corrections and pullbacks, which tend to be short-term in nature, bear markets are typically longer lasting.
Viewing Volatility More Clearly
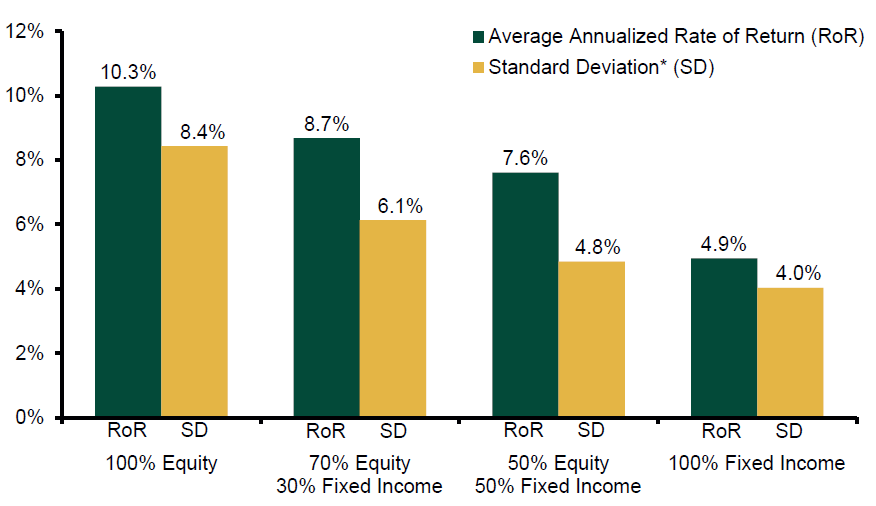
Historical volatility can be valuable in evaluating the risk/reward ratios of potential investments over different periods. For example, Exhibit 1 shows standard deviation (one way to measure market volatility) and average returns for different allocations of stocks and bonds over 5- and 30-year rolling periods.
Exhibit 1: Long-Term Asset Allocation
5-Year Rolling Periods
30-Year Rolling Periods
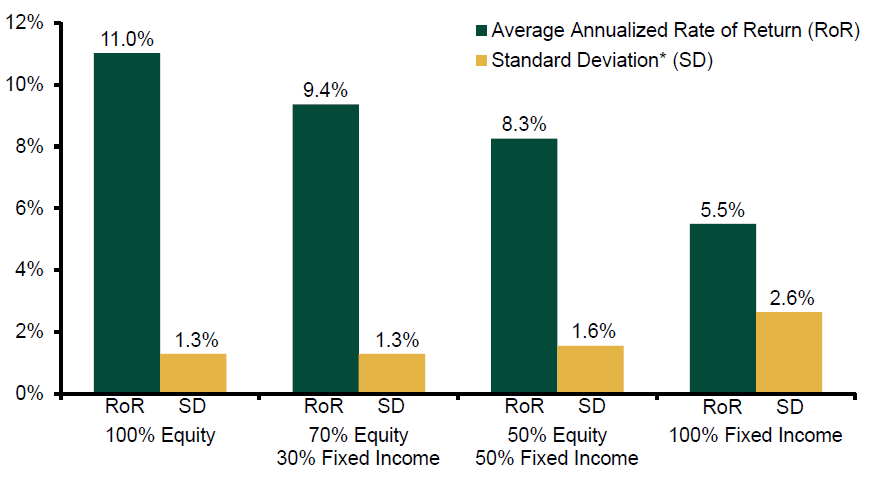
Exhibit 1 Long-Term Asset Allocation
This exhibit contains two bar charts, each comparing four asset mixes from 100% Equity to 100% Fixed Income. Dark green bars show the average annualized rate of return; yellow bars show the standard deviation, a measure of risk where lower is better. Both axes run from 0% to 12%.
The first chart covers 5-year rolling periods. Returns decrease as equity exposure drops: 100% Equity returned 10.3% (standard deviation 8.4%), the 70/30 mix returned 8.7% (6.1%), the 50/50 mix returned 7.6% (4.8%) and 100% Fixed Income returned 4.9% (4.0%). Over this shorter timeframe, equity-heavy mixes show the highest returns but also the most short-term volatility.
The second chart covers 30-year rolling periods. Returns remain higher with more equity: 100% Equity returned 11.0% (standard deviation 1.3%), the 70/30 mix returned 9.4% (1.3%), the 50/50 mix returned 8.3% (1.6%) and 100% Fixed Income returned 5.5% (2.6%). The risk picture also reverses over this longer horizon: equity-heavy mixes show lower volatility than the fixed income portfolio.
Over five years, stocks carry more volatility. Over 30 years, that flips: equity-heavy mixes deliver higher returns and lower risk than fixed income. If you have a long time horizon, holding more stocks may work in your favor.
Source: Finaeon, as of 1/5/2026.
*Standard deviation is a measure of the dispersion of a set of data from its mean and is used as a measure of risk. The higher the variation in a product’s returns, the greater its standard deviation. Therefore, lower standard deviation is generally preferable.
Source: Finaeon, as of 1/5/2026. 5- and 30-year rolling returns from 12/31/1925 – 12/31/2025. Equity return based on the S&P 500 Total Return Index. Fixed income return based on Global Financial Data’s USA 10-Year Government Bond Index.
Over shorter time periods, like 5-year rolling periods, stocks have higher average returns along with a higher standard deviation than bonds. However, over 30-year rolling periods, stocks have higher average returns with a lower standard deviation than bonds.
The historical volatility associated with a portfolio of stocks relative to bonds smooths out over longer periods of time. That means, for longer-term investors, an all-stock portfolio may actually be less volatile over the long-term than investing in bonds, depending on the circumstances. Despite this reality, many investors fail to realize stocks’ long-term growth potential because they react to stocks’ short-term swings and make costly investing errors which could set them back in reaching their long-term goals.
Find out how Fisher Investments can help you reach your long-term goals.
Request an Appointment
Staying Calm During Periods of Heightened Volatility
The stock market can be challenging for investors to navigate. Even bull markets are subject to negative volatility, as uninterrupted periods of rising prices are rare in the long term. Therefore, even as stock markets rise, volatility is a common phenomenon.
Bull markets often feature multiple corrections—short, sharp, sentiment-based declines of roughly -10% to -20% that typically end just as quickly as they began. Corrections can be triggered by any number of events, including geopolitical tensions, elections, economic news or natural disasters. Other times, corrections may happen for no reason at all. Like other forms of market volatility, corrections are unpredictable and very difficult to anticipate.
Although corrections are part and parcel to investing, they can still surprise and scare many investors. While difficult, we recommend investors stay calm during periods of heightened market volatility, as they may risk making fear-based decisions that might hurt their long-term portfolio returns.
Fortunately, the types of events that typically drive short-term volatility are often not big or bad enough to cause a full-fledged bear market, which is a fundamentally driven, extended market decline of approximately 20% or more. Although investing through a bear market or a correction is often difficult, it may be worthwhile to weather the storm.
What Market Volatility Means for Investors
Market volatility is part of the tradeoff equity investors accept when pursuing long-term equity-like returns. That does not make volatility easy to endure. It means negative and positive market fluctuations are part of owning stocks, and investors should consider volatility in the context of their goals, time horizon and risk tolerance.
For a long-term investor, the bigger risk may be reacting to every volatile period as though it requires action. Big price swings can feel urgent in the moment, but abandoning a measured strategy can increase the risk of missing a recovery or changing course after prices have already moved.
Since things like pullbacks and market corrections can start or stop for any—or no clear—reason, trying to make trades in reaction to short-term volatility can sometimes do more harm than good. Even experienced investors can make poorly timed trades when attempting to sidestep corrections or wait for calmer conditions to re-enter markets.
Reacting emotionally to recent stock price swings may leave investors buying or selling at the wrong times, which could put a damper on your long-term returns. Investment management is a long-term endeavor, and Fisher Investments believes staying disciplined to your long-term strategy is critical to long-term investment success.
Ready to start your journey to a better financial future?
Request an Appointment
Learn More About Stock Market Volatility
Volatility is a normal part of investing in stocks, but understanding how volatility works and what causes it can help investors avoid reactionary decisions during market swings. For long-term investors, we think it’s important to remember that while market volatility can be difficult to navigate at times, it does not reliably predict future market returns.
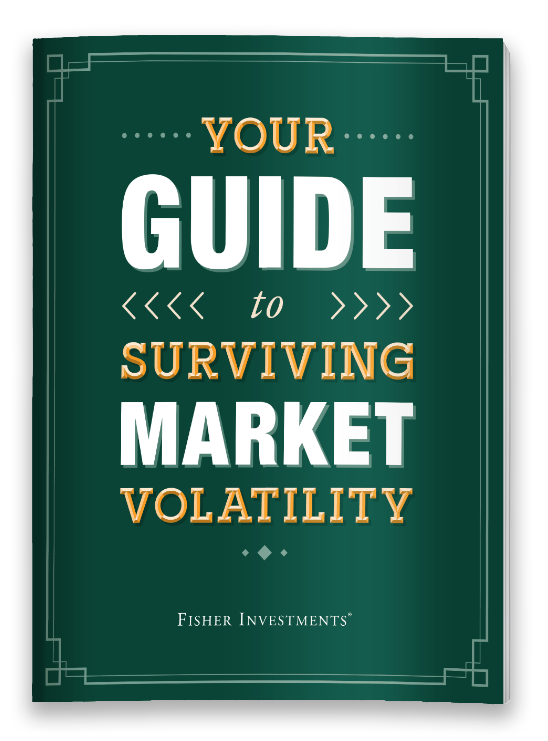
At Fisher Investments, we are committed to educating investors and helping them guard against behavioral investing mistakes. Download our free Guide to Surviving Stock Market Volatility or contact Fisher Investments to learn more about navigating markets when things get turbulent.
Market Volatility FAQs
How Does Volatility Relate to Stock Market Cycles?
Volatility can occur throughout stock market cycles. Short-term declines such as pullbacks and corrections often feature heightened volatility, and are common during bull markets, while bear markets are typically deeper, longer-lasting and more fundamentally driven declines.
Can You Predict Short-Term Stock Market Volatility?
Not reliably. Investors can study historical volatility, implied volatility, investor sentiment and market conditions, but short-term volatility can appear quickly and for any or no clear reason.
How Should Investors React to Volatility?
Investors should avoid reacting emotionally to short-term market swings. For many investors, the more useful approach is to evaluate volatility within a long-term investing strategy rather than trying to time short-term market moves.
What Is the Difference Between Historical Volatility and Implied Volatility?
Historical volatility measures past price fluctuation, often using standard deviation. Implied volatility reflects expected volatility derived from options prices, such as the Cboe Volatility Index (VIX).
This article is for informational and educational purposes only and should not be construed as investment advice or a recommendation regarding any particular investment strategy or course of action. The information presented is general in nature and does not take into account the individual circumstances, objectives, or financial situation of any specific investor. We provide our general comments to you based on information we believe to be reliable. There can be no assurances that we will continue to hold this view; and we may change our views at any time based on new information, analysis or reconsideration. Some of the information we have produced for you may have been obtained from a third-party source that is not affiliated with Fisher Investments.
Fisher Investments has no duty or obligation to update the information contained herein.
[i] Source: FactSet, as of 6/16/2026. Daily S&P 500 Total Return Index, from 12/31/1987 – 12/31/2025.

You Imagine Your Future. We Help You Get There.
Are you ready to start your journey to a better financial future?
Get Help Navigating Challenging Markets
Your Guide to Surviving Market Volatility gives investors the guidance they need to answer such critical questions in any volatile period and stay on track to meet their long-term goals.
Insights & Media
-
Market Analysis Gradually Then Suddenly, UK Budget Clarity Is Coming2026-10-15
-
Market Analysis On September Inflation, Look Beyond the Headlines2026-10-14
-
Politics Is Canada Building a Stronger Bull Market?2026-10-13
-
Market Analysis Don’t Overstate AI’s Threat to Bank Profits2026-10-13





Learn More
Learn why 210,000 clients trust us to manage their money and how Fisher Investments and its affiliates may be able to help you achieve your financial goals.
As of 9/30/2026
New to Fisher? Call Us.
Contact Us Today