Personal Wealth Management / Market Analysis
A Data Snapshot as Winter Wound Down
A look at some widely watched data before the US financial sector’s turbulence.
What are the economic implications of America’s regional bank saga earlier this month? Speculation abounds in financial publications we monitor, but our review of the latest US lending data suggests US banks didn’t turn ultra conservative and cease lending.[i] Alongside those weekly numbers, several monthly economic indicators came out last Friday. These reports cover a period predating March’s US financial sector ripples. But in our view, the data suggest that, entering this period, developed economies were faring considerably better than expectations of market observers and economists we follow from the start of the year.
March Flash PMIs: A Services Story
Major developed economies grew in March, according to S&P Global’s flash purchasing managers’ indexes (PMIs). PMIs are monthly business surveys where readings above 50 imply expansion and below 50 suggest contraction. The broad takeaway from March: Services drove growth whilst manufacturing contracted. (Exhibit 1)
Exhibit 1: The Latest PMIs
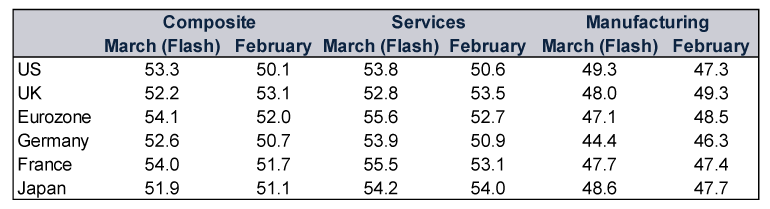
Source: S&P Global, as of 24/3/2023. US readings differ from the US-based Institute for Supply Management’s separate PMI series.
Services firms in America and the UK reported improving domestic demand whilst Japanese services benefitted from a tourism boost tied to China’s eased COVID restrictions.[ii] On the Continent, services growth wasn’t restricted to just the largest economies, Germany and France. As S&P Global noted, “It was the rest of the eurozone as a whole that again reported the strongest performane, the composite index up from 53.4 to an 11-month high of 55.5. Services activity surged higher at a rate not seen since November 2021 and manufacturers reported a modest upturn in production for a second successive month.”[iii]
As the preceding table shows, things didn’t appear as rosy on the manufacturing side. Firms from reporting nations noted weaker demand, with activity tied largely to the fulfillment of order backlogs post-pandemic.[iv] Looking ahead, manufacturing weakness may linger as new orders—which reflect future production—continued contracting in March (e.g., US new orders have fallen for six straight months).[v]
In our view, the latest flash PMIs reinforce a well-known reality: Global economic growth is mixed. Take manufacturing’s struggles, which aren’t new. In the past six reported months, manufacturing output contracted three times in the US, Japan and eurozone—and four times in the UK.[vi] Now, we don’t dismiss the possibility slowing factory activity tips some nations into recession (a period of contracting economic output). Our research shows Europe’s energy supply issues, for example, have weighed on Germany’s economy—though markets have likely pre-priced much of that impact already, in our view. Whilst manufacturing’s struggles may be a headwind for the global economy, we don’t think they will necessarily impede growth. Why? The services sector is the majority of economic output in developed nations, so its growth can support global expansion.[vii]
On UK Retail Sales’ Strong February
UK February retail sales volumes, which measure the quantity of goods bought, rose 1.2% m/m, its biggest monthly gain since last October.[viii] Growth in this inflation-adjusted measure indicates consumers spent despite elevated prices. But we observed some financial commentary outlets add caveats to February’s strength, highlighting higher sales at discount and second-hand goods shops (e.g., auction houses and charity shops) as well as food stores—with the latter suggesting consumers were trying to save by eating at home instead of at restaurants. In our view, the broader implication of raising this theme: Sure, consumers are spending, but only selectively because of cost-of-living pressures.
In our view, this is a case of the consensus applying inconsistent logic to retail sales volumes. Last year, we read many arguments that the divergence between sales values (which reflect the amount spent) and volumes purportedly signalled the loss of consumers’ purchasing power due to higher prices. (Exhibit 2) Now we have seen arguments shift, with some commentators claiming retailers’ discounting is boosting sales volumes—which we think overlooks that discounting means consumers are regaining purchasing power. This thinking is contradictory, in our view.
Exhibit 2: The Divergence in UK Retail Sales
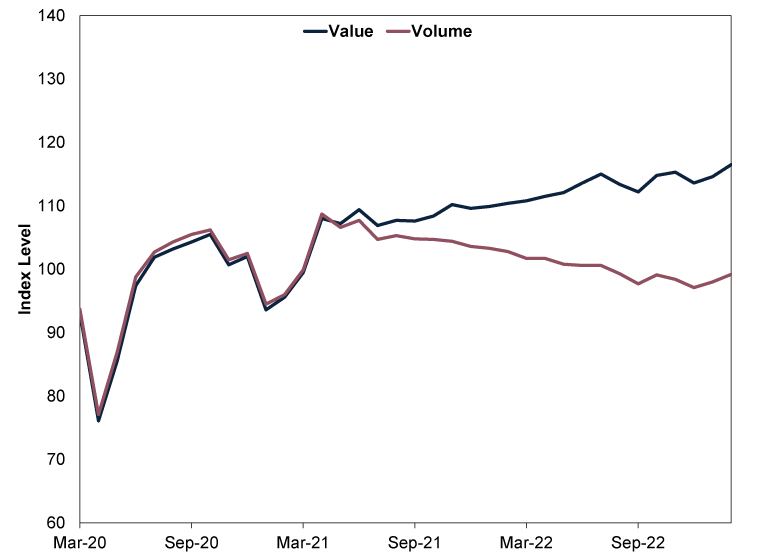
Source: Office for National Statistics, as of 24/3/2023.
One month doesn’t make a longer-term trend, but in our view, February’s growth reinforces the notion consumer spending is resilient even amidst challenging economic conditions.
What Are Core Capital Goods Orders Saying?
US durable goods orders fell -1.0% m/m in February, missing economists’ consensus expectations for 1.0% growth.[ix] But in our experience, many economists focus on core capital goods orders (which exclude volatile defense and aircraft orders), widely considered to be a leading indicator of business investment, since it reflects equipment spending—one component of the broader category. This subset rose 0.2% m/m, its second straight rise following two monthly contractions.[x]
Looking more broadly, core capital goods orders, which aren’t adjusted for inflation, have mostly shot higher since the US economy reopened. (Exhibit 3) We think it is logical to attribute some of that rise to elevated prices over the past two years.[xi] But orders have slowed in recent months, which we think may signal some easing demand.
Exhibit 3: US Core Capital Goods Orders, December 2019 – February 2023
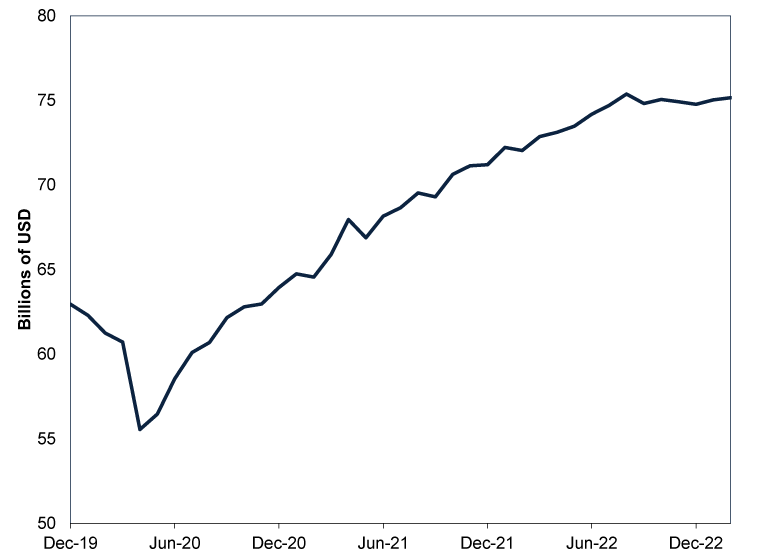
Source: FactSet, as of 27/3/2023.
We think concerns about flagging business investment are understandable, as we find the category is often recession’s swing factor—and weakening equipment expenditures could detract from GDP. But equipment spending comprises about 40% of total business investment, and core capital goods orders don’t reflect investment in structures or intellectual property (e.g., research & development).[xii]
Consider: Q4 US GDP grew 2.7% annualised despite equipment investment’s -0.17 percentage point detraction.[xiii] Moreover, that contraction didn’t prevent business investment from contributing 0.43 percentage point to growth.[xiv] Structures added 0.21 percentage point whilst intellectual property products contributed 0.39 percentage point—offsetting equipment’s dip.[xv] Though a slowdown in capital goods spending or US recession remain possible, the data don’t confirm a downturn is inevitable, either.
[i] Source: US Federal Reserve, as of 27/3/2023. Statement based on review of US Federal Reserve’s “Assets and Liabilities of Commercial Banks in the United States” for the week ending 15 March 2023.
[ii] Source: S&P Global, as of 27/3/2023.
[iii] Ibid.
[iv] Ibid.
[v] Ibid.
[vi] Source: FactSet, as of 24/3/2023. Statement based on monthly change in manufacturing component of industrial production through February 2023 for the US, January 2023 for the UK and Japan, and December 2022 for the eurozone.
[vii] Source: The World Bank, as of 27/3/2023. Statement based on value added of services sector as a percentage of GDP (gross domestic product, a government-produced measure of economic output). For the US, 77.6% (as of 2021); UK, 71.5% (as of 2021); eurozone 65.7% (as of 2021) and Japan 69.5% (as of 2020).
[viii] Source: Office for National Statistics, as of 27/3/2023.
[ix] Source: FactSet, as of 27/3/2023. Durable goods refer to purchased consumer products that are expected to last at least three years (e.g., automobiles or furniture).
[x] Ibid.
[xi] Ibid. Statement based on year-over-year change in US Consumer Price Index (CPI, a measure of economy-wide prices), March 2021 – February 2023.
[xii] Source: Bureau of Economic Analysis, as of 27/3/2023.
[xiii] Ibid. An annualised growth rate represents the rate at which GDP would grow over a full year if the quarter-on-quarter percent change repeated all four quarters.
[xiv] Ibid.
[xv] Ibid.
Get a weekly roundup of our market insights.
Sign up for our weekly e-mail newsletter.

You Imagine Your Future. We Help You Get There.
Are you ready to start your journey to a better financial future?

Markets Are Always Changing—What Can You Do About It?
Get tips for enhancing your strategy, advice for buying and selling and see where we think the market is headed next.
Related Resources
-
Market Analysis A Market Perspective on Iran Truce Talks2026-06-17
-
Market Analysis Gold Fails the Safe Haven Test Again2026-06-17
-
Macro Insights Japanese Equity Outperformance & Why It's Poised to Continue2026-06-15
-
Macro Insights Assessing Private Credit Risks and Exposures2026-06-09


Contact Us
Learn why 200,000 clients trust Fisher Investments and its affiliates to manage their money and find out how we may be able to help you achieve your financial goals.
As of 31/03/2026. Includes Fisher Investments and its affiliates.
New to Fisher? Call Us.
Contact Us Today