Personal Wealth Management / Economics
Italy’s Debt Still Looks Like a False Threat
Whilst the country’s debt load is up, it remains more affordable than ever, as we will show.
If we had to make a list of habits investors can’t shake, fighting the last war would be near the top—whenever a big event roils markets, if financial commentators we follow are any indication, people tend to look out for a repeat for years afterward. That seems to apply today, with Italian debt fears storming back into headlines we have seen. Due to the one-two punch of last year’s steep economic contraction and the borrowing binge to fund relief measures, Italy’s debt-to-GDP ratio is jumping again—from 134.3% at 2019’s end to 155.2% as of Q3 2021.[i] (GDP, or gross domestic product, is a government-produced measure of economic output. Economists often compare debt to GDP as a way to control for a country’s size when gauging whether debt is high.) Now that the European Central Bank (ECB) is poised to close its pandemic-related “emergency” quantitative easing (QE) and reduce monthly bond purchases to €40 billion next April, an old ghost story is back: Italian debt. Without the ECB buying massive amounts of Italian bonds, many commentators we follow warn the country’s debt costs will surely soar, delivering the long-awaited debt crisis—big trouble for Italy’s economy and stocks. In our view, a quick trip in the way-back machine debunks this handily.
We think Exhibit 1 demonstrates that Italy’s low bond yields don’t appear to depend on ECB QE. For one, the first QE programme didn’t even start until March 2015, by which time Italy’s 10-year yield had fallen from north of 7% in 2011 to just 1.33%.[ii] Yields actually rose for a spell after bond purchases began, but they were back below 1.5% by the time the ECB increased its monthly asset purchases from €60 billion to €80 billion in March 2016.[iii] After the ECB’s December 2016 announcement it would slow bond buying to €60 billion monthly the following April (the bank’s first attempt at tapering QE without actually using the term), Italy’s 10-year yield moved mostly sideways for almost a year and a half.[iv] It wiggled higher as the program neared its December 2018 end, but then it plunged below 1.0% in September 2019.[v] That is when the ECB announced it would resurrect QE that November—and yields rose.[vi] In our view, there is just no discernible relationship here.
Exhibit 1: Italian Bond Yields Seemingly Ignored QE
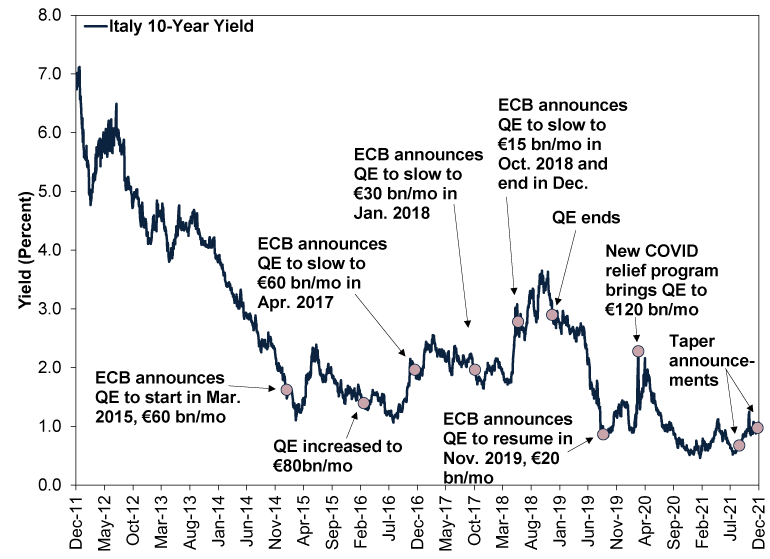
Source: FactSet and European Central Bank, as of 23/12/2021. Italy 10-Year Benchmark Government Bond Yield, 22/12/2011 – 22/12/2021.
Whilst we think credit risk does influence individual countries’ bond yields, our research also finds that developed-world yields are highly correlated globally, meaning, their directional moves tend to track one another much more often than not. Italy’s wiggles over the past several years have largely echoed global moves, and the ECB’s recent moves to taper QE haven’t changed that.[vii] Moreover, we think markets are forward-looking, and the ECB’s plans are well known, thanks to the widespread coverage of the bank’s announcement last week. If markets thought Italian debt were a material risk, we would likely see it in Italian yields relative to US Treasurys, which have a deep, liquid market and which market participants perceive as having little to no risk the they won’t be repaid principal and interest. Therefore, if trouble were brewing, we think Italy’s borrowing costs should far exceed America’s as investors sought a higher premium for the higher risk. But that isn’t the case: Italy’s 10-year bond trades about 40 basis points (or 0.4 percentage point) below the US’s.[viii] In our view, if there is a better sign that markets have priced in Italy’s debt and are signaling that it isn’t a problem, it would be hard to find.
Now, markets can be quite inefficient in the short term, but in this case, we think they are correctly taking a rational longer-term view. Italy’s big debt load isn’t due at once. It matures over time, and the government appears to have no trouble replacing retiring bonds with new ones. We think this leaves interest payments—the cost of servicing that debt—as the swing factor. As Exhibit 2 shows, even though Italy’s debt is up, its debt service costs are down thanks to those several years of low rates shown in Exhibit 1. That enabled the country to refinance its debt stock at lower and lower rates, easing the annual burden on Italy’s treasury even as the amount of debt outstanding rose. Interest payments finished September at just 11.4% of tax revenues over the prior 12 months—the lowest on record.[ix]
Exhibit 2: Italy’s Debt Is More Affordable Than Ever
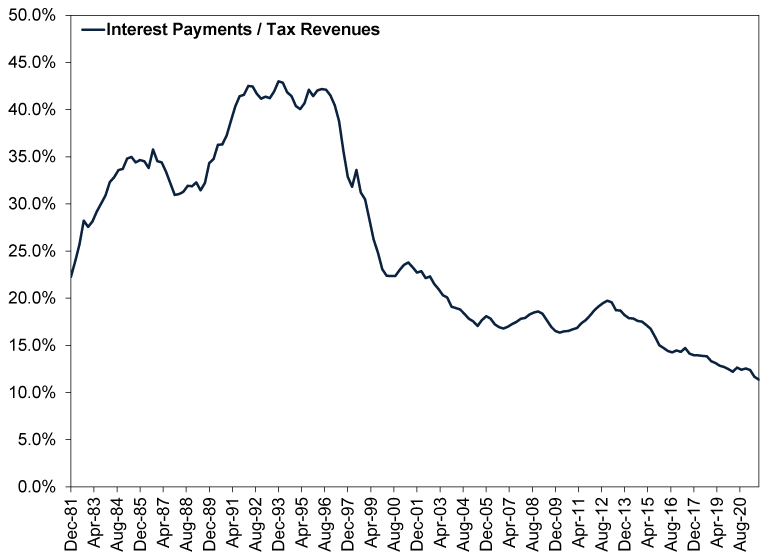
Source: FactSet, as of 12/22/2021. Italian net government debt interest payments divided by tax revenues, trailing 12 months, 12/31/1980 – 9/30/2021. “Net” debt means debt excluding securities owned by Italian government agencies.
Italy’s debt service costs topped 40% of tax revenues for much of the 1990s, when central banks’ buying long-term bonds was unheard of.[x] If the country didn’t have a debt crisis then, that suggests to us it would take much, much more than a slight move higher in long rates for real trouble to arrive. Rates would likely have to soar to nosebleed levels—far from where they are today. Then, crucially, they would have to remain there for eons whist the country refinanced its maturing bonds. Anything is possible in the long run, but in the timeframe we think markets care about—the next 3 – 30 months—we think it is exceedingly unlikely. That doesn’t preclude some short-term wiggles—bond markets are volatile, too—but it does argue against a sudden, massive jump in Italian borrowing costs, in our view.
[i] Source: FactSet, as of 22/12/2021.
[ii] Ibid. Italy 10-year benchmark government bond yield, 31/12/2010 – 28/2/2015.
[iii] Ibid. Statement based on Italy 10-year benchmark government bond yield.
[iv] Ibid.
[v] Ibid.
[vi] Ibid.
[vii] Ibid. Statement based on 10-year benchmark government bond yields for Italy, France, Germany, the US and the UK.
[viii] See Note i.
[ix] Ibid.
[x] Ibid.
Get a weekly roundup of our market insights.
Sign up for our weekly e-mail newsletter.

You Imagine Your Future. We Help You Get There.
Are you ready to start your journey to a better financial future?

Markets Are Always Changing—What Can You Do About It?
Get tips for enhancing your strategy, advice for buying and selling and see where we think the market is headed next.
Related Resources
-
Macro Insights Brazil Review & Outlook2026-06-04
-
Market Analysis Global Bond Calamity Calls for Calm Perspective2026-05-27
-
Economics A May Global Economic Check-In2026-05-26
-
Macro Insights Macro Insights Q2 20262026-05-22


Contact Us
Learn why 200,000 clients trust Fisher Investments and its affiliates to manage their money and find out how we may be able to help you achieve your financial goals.
As of 31/03/2026. Includes Fisher Investments and its affiliates.
New to Fisher? Call Us.
Contact Us Today