


Personal Wealth Management / Market Analysis
Global Bond Calamity Calls for Calm Perspective
In our view, today’s bond market conversation lacks scale and context.

Are rising government bond yields signalling economic trouble ahead? Many commentators we follow say so, arguing multi-decade-high 10- and 30-year yields across the developed world foretell hot inflation (broadly rising prices across the economy) and government debt troubles, worsening the outlook for bonds (and probably eventually stocks).[i] But hold on. We think these warnings lack context and perspective. Long-term bond yields’ recent supposed spike is benign historically, as we will show, and our research finds bonds—like stocks—are prone to short-term volatility for any or no reason at all. In our view, nothing about this suggests bonds will fail to serve what we think are their primary roles of mitigating volatility and supporting cash flow needs.
Long-term bond yields are up globally and, in some cases, hover near levels unseen in years. Exhibit 1 shows today’s 30- and 10-year yields in the US, UK, Germany and Japan (the main focusses amongst commentators we follow) and the last time they notched these levels.
Exhibit 1: Global Long Yields Are Up

Source: FactSet, as of 26/5/2026. 30- and 10-year benchmark bond yields in the US, UK, Germany and Japan, 31/12/1979 – 22/5/2026. *Notes: Continuous UK 30-year Gilt data begin in April 1998. Japan 30-year yields are at all-time highs in data through 1999. Both Japan and the UK issued 20-year bonds more heavily historically.
Bond yields move opposite prices, so rising yields can indicate a selloff. And as we find they often do when stocks sell off, commentators we follow seem to be racing to find an explanation. This time, they claim investors are dumping government debt with the presumption that high deficits will knock bond prices further as the market struggles to absorb increased supply and hot inflation erodes future interest payments’ purchasing power. Perhaps this thinking is influencing investor behaviour somewhat, but nothing here looks like a crisis to us.
For one, long-term bond yields aren’t spiking like many publications we follow suggest. In most cases, they are up somewhat—but not markedly over the range seen since 2022. Instead, we think they are returning to normal as the last decade and a half’s monetary policy experiments fade further into the rearview. (Exhibit 2)
Exhibit 2: Bond Yields Are Benign
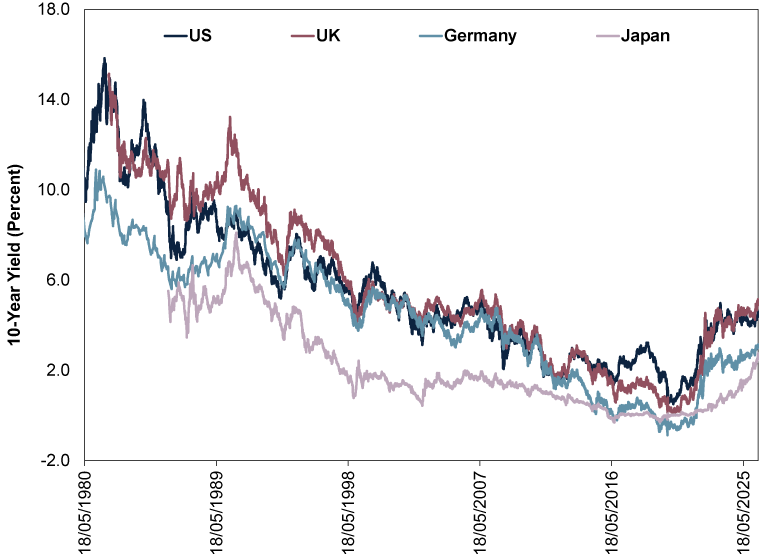
Source: FactSet, as of 19/5/2026. 10-year benchmark bond yields in the US, UK, Germany and Japan, 18/5/1980 – 18/5/2026.
US 30-year yields are also well below levels seen in the 1980s and early 1990s.[ii] At roughly 5.0%, they are floating near where they sat for much of the early- to mid-2000s, before the Federal Reserve (Fed) responded to 2007 – 2009’s global financial crisis by deliberately quashing long rates via its “quantitative easing” (QE) program of long-term bond purchases.[iii]
The Fed, Bank of England (BoE), European Central Bank (ECB) and Bank of Japan (BoJ) all had long-running QE programmes, with the BoJ pioneering the practice in 2001 and the others following years later. The theory was such action would reduce long-term yields, making credit cheaper and more abundant, boosting growth. We don’t think it achieved the economic goal, which is a topic for another day, but it resulted in historically low long-term bond yields throughout the 2010s and early 2020s.[iv] The recent rise coincides with monetary policy institutions’ winding down and in some cases reversing these programmes, reverting to more normal monetary policy and, therefore, rates.
In our view, today’s widespread chatter declaring today’s rates sky-high—rather than a return to normal—smacks of recency bias. It seems to us observers we follow are anchoring to the last decade’s low rates as the new normal, forgetting they are a historical aberration caused by monetary policy meddling, not market forces. Now market forces have more sway—which we think is an overall positive development. When markets can accurately price risk, our research suggests they allocate capital more efficiently.
Note, too, those pre-QE yields didn’t accompany hot inflation. US consumer price index (CPI, a government-produced index tracking prices of commonly consumed goods and services) inflation averaged 2.8% y/y in the decade leading up to the Fed’s initial QE foray in November 2008, as yields hovered near present levels.[v] That is below its roughly 3.3% average since data start in 1914 (3.5% in the postwar era).[vi] Similarly, the UK’s 1.9% y/y average in the decade leading up to the BoE’s March 2009 QE commencement is well below the 2.9% average since modern UK inflation data begin in January 1989.[vii] If normal yields coexisted with normal inflation then, why would a return to those yields now suddenly mean hot inflation looms?
We would be remiss not to mention Japanese yields’ rise, which is sharper than the others.[viii] But as we wrote in December, much of this appears to be linked with the Bank of Japan’s first steps toward normalising monetary policy by tapering QE bond purchases in March 2024.[ix] The country’s massive state-run postal service/banking hybrid Japan Post also plays less of a role in Japanese bond markets now that its privatisation is complete. Thus, Japanese yields’ rise—whilst sharper than its developed world peers—also looks to us like a reversion to more traditional developed world conditions.
As for the latest wiggles, our research finds bond market volatility is normal. In both stocks and bonds, swinging sentiment—for any or no reason—can spur short-term choppiness. But as the aforementioned data show, today’s swings are benign historically, and we doubt they mean inflation and high government debt are set to send yields spiralling higher for longer from here.
We think bond prices (like all prices) move on supply and demand, and right now, data suggest to us headlines we follow are overstating pressures on both fronts. On the demand side, inflation doesn’t look set to spike from here. Consider: Inflation is a monetary phenomenon of too much money chasing too few goods and services, as Nobel prizewinning economist Milton Friedman taught decades ago. Yet money supply across the developed world is growing at prepandemic rates, when inflation was tame.[x] We find businesses struggle to pass higher costs onto customers without broad money supply rising to boost consumer demand. Today’s tepid money growth drives many businesses worldwide to report weak pricing power, likely keeping inflation at bay despite higher energy costs.
As for supply allegedly overwhelming demand as governments finance burgeoning deficits, we assess this by weighing bond auctions’ bid-to-cover ratios, or the monetary value of bids relative to the face value of debt sold. Higher ratios generally signal stronger demand. As Exhibit 3 shows, recent auctions saw fine demand—some even nicely above average.
Exhibit 3: Bond Auction Demand Remains Solid
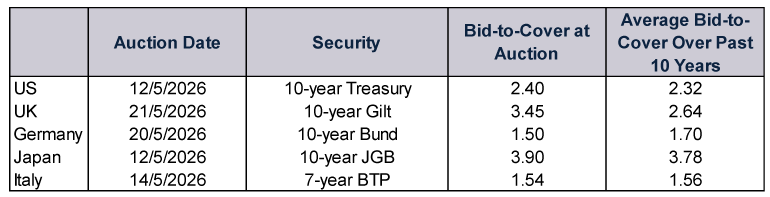
Source: US Treasury, UK Debt Management Office, Germany Finance Agency, Japan Ministry of Finance and Italy Ministry of Economy and Finance, as of 21/5/2026. Note: Italy hasn’t yet auctioned 10-year bonds this month.
If government debt demand were really sinking, we presume these ratios would likely be much lower. Bid-to-covers around their decade-long averages isn’t what we would expect if investors were fleeing in terror.
Most importantly for long-term investors, in our view, bonds are still playing their primary role in portfolios—helping mitigate stocks’ short-term bumpiness whilst supporting cash flows. The discussions of bonds’ wiggles we see latesly omit the fact that bonds have experienced lower volatility than stocks this year. Not only is the FTSE 100’s 5.4% year-to-date return sharper than the ICE BofA Sterling Broad Market 7 – 10 year index’s -1.9%, but UK stocks’ ride has been much bumpier tied to war-related energy concerns—March’s correction-like drop is proof of this, a much bigger drawdown than anything bonds have experienced year to date.[xi] Decades of research tell us volatility cuts both ways, and low volatility doesn’t always mean positive low volatility.
But even if yields did look likely to rise and stay there, we don’t think dumping bond holdings is investors’ only option. We think it is a matter of managing a bond portfolio for interest rate risk, as shorter maturities tend to be less sensitive to interest rate moves. As with stocks, we think it is critical to look forward and not react to short-term volatility, which suggests to us this isn’t a time to do so. We find rushing into short-term securities after yields tick up can risk leaving investors flat-footed if the volatility proves temporary and yields fall again.
Nonetheless, our broader point stands: If an investor needs bonds as part of their long-term portfolio strategy, we don’t think a yield uptick negates that—especially if it is sentiment-driven, which we think is the case today.
[i] Source: FactSet, as of 19/5/2026. 30- and 10-year benchmark bond yields in the US, UK, Germany and Japan, 31/12/1979 – 18/5/2026.
[ii] Ibid. US 30-year benchmark bond yield, 31/12/1979 – 18/5/2026.
[iii] “Fed, In Major Shift, Floods System with Cash,” John W. Schoen, NBC News, 25/11/2008.
[iv] See note i.
[v] Source: FactSet, as of 19/5/2026. US monthly CPI, year-over-year growth, October 1998 – October 2008.
[vi] Ibid. US monthly CPI, year-over-year growth, January 1914 – April 2026.
[vii] Ibid. UK monthly CPIH, year-over-year growth, January 1989 – April 2026. The Consumer Prices Index including owner occupiers’ housing costs, or CPIH, is a government-produced index tracking prices of commonly consumed goods and services.
[viii] See note i.
[ix] “BOJ’s Exit, Struggling with its Enormous Balance Sheet,” Ikuko Samikawa, Mayuko Abe, Kayami Takamuku and Tomosato Hiroshiba, Japan Center for Economic Research, 19/3/2024.
[x] Source: FactSet and Center for Financial Stability, as of 19/5/2026. Statement based on year-over-year growth in US M4, UK M4 excluding intermediate other financial corporations (OFCs), Eurozone M3 and Japan M2, monthly, December 2016 – April 2026.
[xi] Ibid. FTSE 100 and ICE BofA Sterling Broad Market 7 – 10 year index price return, 31/12/2026 –22/5/2026. A correction is a sentiment-driven decline of around -10% to -20%.
Get a weekly roundup of our market insights.
Sign up for our weekly e-mail newsletter.

You Imagine Your Future. We Help You Get There.
Are you ready to start your journey to a better financial future?

Markets Are Always Changing—What Can You Do About It?
Get tips for enhancing your strategy, advice for buying and selling and see where we think the market is headed next.
Related Resources
-
Market Analysis A Market Perspective on Iran Truce Talks2026-06-17
-
Market Analysis Gold Fails the Safe Haven Test Again2026-06-17
-
Macro Insights Japanese Equity Outperformance & Why It's Poised to Continue2026-06-15
-
Macro Insights Assessing Private Credit Risks and Exposures2026-06-09



Contact Us
Learn why 200,000 clients trust Fisher Investments and its affiliates to manage their money and find out how we may be able to help you achieve your financial goals.
As of 31/03/2026. Includes Fisher Investments and its affiliates.
New to Fisher? Call Us.
Contact Us Today