Personal Wealth Management / Economics
A Q1 Growth Check-In
A look at US retail sales and industrial production.

US retail sales and industrial production for February came out this week, and they aren’t anything to write home about. Like other indicators lately, they were mixed. But they also don’t signal the economy is on the precipice of recession, and a closer look suggests to us economic reality entering March was better than commonly perceived.
Headline results were, in a word, blah (to use a technical term). Retail sales fell -0.4% m/m, but that followed January’s big, upwardly revised 3.2% jump.[i] Both of those monthly moves were led by autos. After surging 7.8% m/m in January, car sales slipped -2.0% last month. Autos’ erratic swings in recent months—as supply chains get back in gear—don’t reflect overall retail sales’ underlying trend. Hence, some economists try to isolate “core” retail sales, which excludes volatile autos, gasoline, building materials and food services. This rose 0.5% m/m after January’s 2.3%.
Either way, don’t overrate retail sales—headline or core—because they omit many services, which comprise most consumer spending. They also aren’t inflation adjusted. But from the data, we don’t see February’s headline giveback—while steadier underlying components continued rising—as a sign things suddenly deteriorated.
Meanwhile, industrial production was flat in February, following January’s 0.3% m/m increase.[ii] The lack of growth was mainly due to mining weakness, as the industry’s output declined -0.6% m/m. Oil and gas extraction and other mining activities fell across the board. With oil and other raw material prices down, that isn’t very surprising. Offsetting mining’s dip, manufacturing ticked 0.1% m/m higher, and utilities rose 0.5%.
Like its monthly move, industrial production’s overall trend has been ho-hum, drifting mostly sideways. From a year ago, factory output is -0.2% lower.[iii] At just 15% of GDP, though, industrial production isn’t anywhere near as big an engine for the economy as services’ 71%.[iv]
For a sense of how incoming monthly data affect overall growth, the Atlanta Fed’s GDPNow model estimates their impact on GDP. While Friday’s industrial production data haven’t been incorporated yet, as GDPNow’s latest update is through March 16, Wednesday’s retail sales report—alongside the BLS’s producer price index (PPI) release—bumped up its Q1 GDP estimate to 3.2% annualized from 2.8%. (Exhibit 1) PPI contributes to inflation adjustments, and its unexpected -0.1% m/m decline in February appears to have helped boost the model’s estimate for real GDP.
Exhibit 1: Evolution of Atlanta Fed GDPNow Q1 GDP Estimate
Source: Federal Reserve Bank of Atlanta and FactSet, as of 3/17/2023. *Range of top 10 and bottom 10 average forecasts.
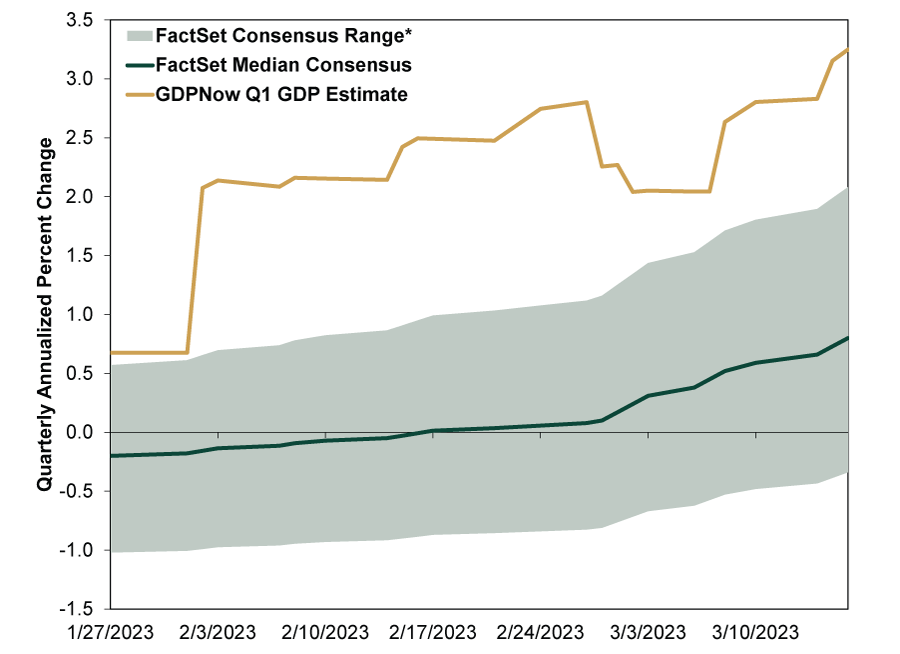
Keep in mind, GDPNow isn’t airtight. The Atlanta Fed is quick to point out: “As more monthly source data becomes available, the GDPNow forecast for a particular quarter evolves and generally becomes more accurate. That said, the forecasting error can still be substantial just prior to the ‘advance’ GDP estimate release.”[v] It relies on historical relationships—which often don’t hold, like during a global pandemic and its aftermath. This is why the New York Fed iced its competing Nowcast.
But with normalcy resuming, model estimates may get closer to the mark—and they also mirror private-sector forecasts’ improvement from slight contraction at Q1’s start to ongoing expansion. The wild card here is the Bureau of Economic Analysis’s long-running issues with Q1 seasonal adjustments, which could result in a contraction if those issues aren’t fixed. But even with that caveat, we think the broad swath of data out so far suggests the economy was faring better than feared entering March.
If you would like to contact the editors responsible for this article, please message MarketMinder directly.
*The content contained in this article represents only the opinions and viewpoints of the Fisher Investments editorial staff.
Get a weekly roundup of our market insights
Sign up for our weekly e-mail newsletter.

You Imagine Your Future. We Help You Get There.
Are you ready to start your journey to a better financial future?

Where Might the Market Go Next?
Confidently tackle the market’s ups and downs with independent research and analysis that tells you where we think stocks are headed—and why.
Related Resources
-
Economics Quick Hit: Durably Broad-Based Growth2026-07-29
-
Market Analysis On the Chop in the Oil Market2026-07-29
-
Politics Takaichi Raises Japan’s Wall of Worry2026-07-27
-
In The News Why Kevin Warsh should think twice about hiking interest rates — even as anxiety over the Iran war grows2026-07-27


Learn More
Learn why 210,000 clients trust us to manage their money and how Fisher Investments and its affiliates may be able to help you achieve your financial goals.
As of 6/30/2026
New to Fisher? Call Us.
Contact Us Today