


Personal Wealth Management / Economics
A Summertime Check-in on US Consumers
US consumer spending keeps on chugging along.

How are US consumers faring? It depends, if you buy recent headlines. The New York Times recently proclaimed, “Americans Are Spending, and Not Just on Necessities,” which sounds positive enough.[i] But they went on to color the coverage with claims high earners are driving growth, tempering the sunny results with clouds. Other outlets go further, bemoaning how rising prices are forcing Americans to cut back elsewhere (e.g., retirement). According to the data, consumer spending—which comprises the lion’s share of US GDP—remains in fine fettle. Concerns otherwise reveal broad US sentiment, while clearly warmer, isn’t overheating yet.
Debates about the state of American consumer spending aren’t new. Since last year, pundits fretted over a “K-shaped economy,” in which high earners can buy things to their heart’s content (the upslope in the K implying growth) while low earners struggle and cut back (the downslope in the K). That logic implies high earners are the primary driver of spending, so if they start showing signs of slipping, the broader economy is in trouble.
Worries deepened in late February after fighting in the Middle East inspired forecasts of higher oil prices and pain at the pump—and potentially renewed hot inflation. While recent Consumer Price Index (CPI) reports indicated prices (including gasoline) are cooling, concerns remain. A few acknowledge the positive data, but examples of consumers’ struggles (e.g., sacrificing retirement saving or using credit card points for basic necessities) grab eyeballs, suggesting a belief that the strong stock market’s mythical “wealth effect” is fueling spending.
Before tackling the popular narrative, let us review the actual data—which have been largely positive. For example, after a flat January, US retail sales grew each month through June.[ii] Though 5 of 13 subindustries contracted last month, growth has been broad-based (e.g., only one subindustry contracted in May).[iii] This isn’t just about gasoline propping up sales, either: Excluding gas stations, retail sales climbed 0.7% m/m in June after May’s 0.9% climb.[iv] Now, retail sales aren’t a comprehensive spending metric since they include just one services-related category (food service & drinking places). They also aren’t inflation-adjusted, so rising retail sales could in part reflect higher prices rather than solid demand alone.
However, inflation-adjusted personal consumption expenditures (real PCE) have also grown this year through May (save for January’s -0.2% m/m dip).[v] Stable consumption isn’t surprising since the majority of spending goes to services, which is generally inelastic (meaning demand doesn’t change with economic conditions). Folks generally don’t stop paying for essentials like housing or health care even during a recession—instead, they are more likely to reduce discretionary purchases first.
So if consumers were pinching pennies, we would expect to see divergence between discretionary and non-discretionary spending—which hasn’t been the case. As Exhibit 1 shows, select non-discretionary PCE categories have generally grown over the past year and a half. Spending on motor fuels dipped recently, which may reflect consumers’ adjusting to higher gas prices (e.g., using public transportation or taking fewer road trips).
Exhibit 1: Spending on Select Non-Discretionary PCE Categories Since January 2025

Source: FactSet, as of 7/20/2026.
But as Exhibit 2 highlights, discretionary spending is also holding up better than inflation fears imply. Sure, spending on watches and jewelry has slipped in recent months, which could signal consumers’ holding off on perceived luxuries.[vi] Yet consumption of recreational goods, clothing and leisure activities (e.g., gyms and sports events) has collectively risen over the past 12 months—not what you would expect if consumers were pulling back on all discretionary purchases.
Exhibit 2: Spending on Select Discretionary PCE Categories Since January 2025

Source: FactSet, as of 7/20/2026.
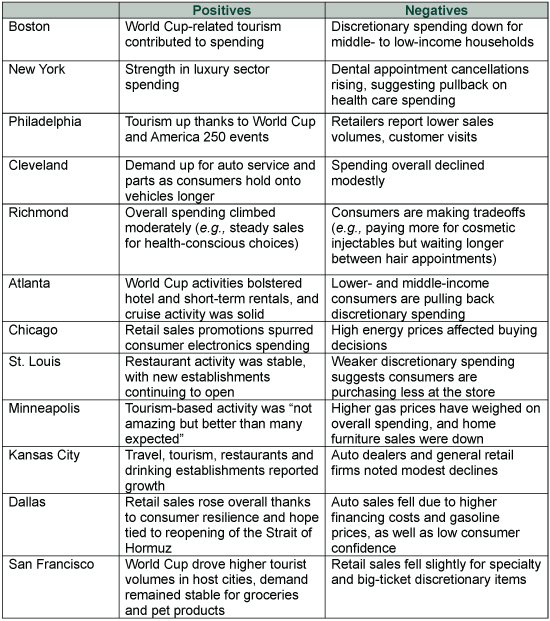
According to the Fed’s latest regional economic reports (summarized in a report known blandly as the Beige Book), consumers are spending. Though findings are heavy on anecdotal evidence, they suggest folks are spending (albeit, selectively), which is consistent with the aforementioned counting data.
Exhibit 3: Select Consumer Spending Takeaways From July Fed Beige Book
Source: Federal Reserve, as of 7/20/2026. The Beige Book for July 2026.
We aren’t saying solid consumer spending at the national level means all is well for all households. As several regional Fed banks found, mid- to lower-income households have to do more substituting—forcing tough choices—than wealthier households, which can be a hardship. But some difficulties like this are a constant and they amount to a sociological discussion, not one that matters much to markets. Stocks care about whether that consumer spending is happening rather than who is doing the spending. So while discussions of a “K-shaped” economy may be worth having for policymakers and academics (even if the mental picture it draws is inaccurate, considering most studies show both higher- and lower-earning households’ consumption is growing, just at differing rates), broad markets likely won’t much mind it.
Consumer Staples and Consumer Discretionary sectors have trailed the headline S&P 500 index year to date (with the latter in the red), suggesting they aren’t blindly dismissing potential headwinds.[vii] To some extent, the lag likely reflects worries over war- and cost-of-living-driven substitution, which could affect profits at the margin. But remember, stocks are forward-looking. As tariffs and war-substitution concerns fade, consumer-oriented businesses should benefit, especially considering expectations are relatively lower compared to other sectors (e.g., AI-hyped Tech). Stocks move most on that gap between expectations and reality, and with spending resilient, the latter doesn’t have a high bar to clear to positively surprise.
[i] “Americans Are Spending, and Not Just on Necessities,” Talmon Joseph Smith and Ben Casselman, The New York Times, 7/16/2026.
[ii] Source: FactSet, as of 7/20/2026.
[iii] Ibid.
[iv] Source: US Census Bureau, as of 7/16/2026.
[v] See note ii.
[vi] Luxury is in the eye of the beholder, of course, and we are fans of pretty watches.
[vii] Source: FactSet, as of 7/22/2026. Statement based on S&P 500, S&P 500 – Consumer Discretionary and S&P 500 – Consumer Staples total return indexes, 12/31/2025 – 7/21/2026.
If you would like to contact the editors responsible for this article, please message MarketMinder directly.
*The content contained in this article represents only the opinions and viewpoints of the Fisher Investments editorial staff.
Get a weekly roundup of our market insights
Sign up for our weekly e-mail newsletter.

You Imagine Your Future. We Help You Get There.
Are you ready to start your journey to a better financial future?
Where Might the Market Go Next?
Confidently tackle the market’s ups and downs with independent research and analysis that tells you where we think stocks are headed—and why.
Related Resources
-
Expert Commentary This Week in Review | AI Debt, French Bond Yields, Oil Prices
 2026-10-23
 -
Behavioral Finance The Risk in Seeking ‘Safety’2026-10-22
-
In The News October ScamWatch2026-10-21
-
Market Analysis A Mid-October US Economic Scorecard2026-10-20




Learn More
Learn why 210,000 clients trust us to manage their money and how Fisher Investments and its affiliates may be able to help you achieve your financial goals.
As of 9/30/2026
New to Fisher? Call Us.
Contact Us Today