Personal Wealth Management / Economics
A Tale of Two Retail Sales Metrics
Statistics can’t seem to agree whether UK retailing is in good or bad shape.

It was the best of times, it was the worst of times. According to the British Retail Consortium (BRC) and KPMG’s retail sales measurement, UK retail sales followed up their worst year ever—and only annual decline—with a lackluster January. Yet according to the Office for National Statistics, crunchers and keepers of all official UK data, retail sales followed a positive 2019—far from the worst on record—with January’s solid 0.9% m/m. One headline today even mismatched the two, oddly declaring January a solid bounce from the worst-ever year. In our view, the disparity underscores why investors shouldn’t get hung up on any one data point.
Exhibits 1 and 2 show BRC and ONS monthly figures since 2019 began and annual figures since 1997, their first year of overlapping data. If you follow these things closely, you may notice the ONS figures in Exhibit 1 don’t match the headline figures you saw in news coverage. This is because the ONS’s main measure is the seasonally adjusted month-over-month change in retail sales volumes, which we think gives the timeliest look and omits skew from price changes. But the BRC doesn’t adjust its figures for seasonality, so it reports only year-over-year change. It also reports total sales values, not volumes, and it doesn’t adjust for inflation. Therefore, to keep like with like, we used the ONS’s year-over-year figures for sales values at current prices instead, and here endeth thy nerdy data ‘splainer.
Exhibit 1: 13 Months of Divergent Retail Sales
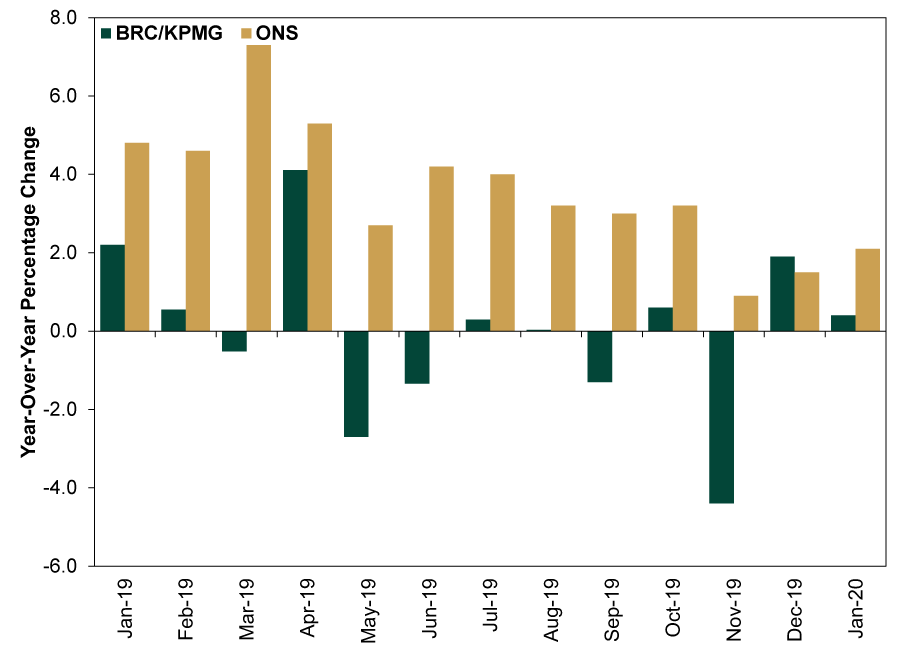
Source: FactSet, as of 2/20/2020 (fun!!). BRC/KPMG UK Retail Sales Monitor—total sales, year-over-year percentage change, and ONS Retail Sales Values—all retailing including fuel, year-over-year percentage change at current prices.
Exhibit 2: 23 Years of Divergent Retail Sales
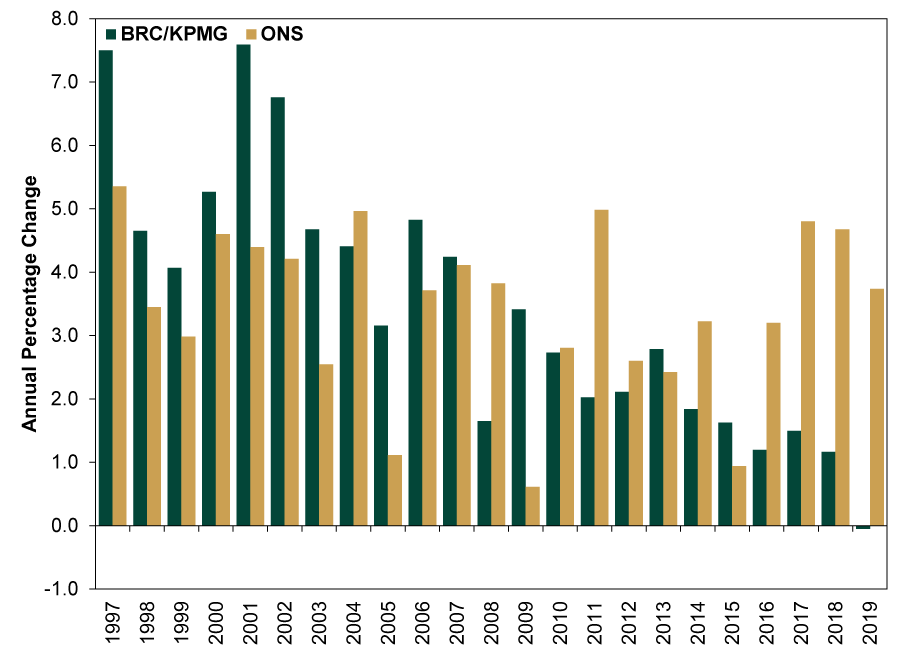
Source: FactSet, as of 2/20/2020. BRC/KPMG UK Retail Sales Monitor—total sales, annual percentage change, and ONS Retail Sales Values—all retailing including fuel, annual percentage change at current prices.
The BRC’s figures always get plenty of ink because they are the first look at monthly retail sales. They typically hit about 10 days before the ONS’s official numbers come out. But in those extra 10 days, the ONS manages to round up a vastly larger data sample. The BRC limits its survey to its 95 members, and participation is voluntary. The companies tend to be larger firms—the same large UK retailers whose woes the financial press has chronicled for years now. While the BRC doesn’t disclose which companies respond, it is something of an open secret that certain online retailer named after a big river in South America that isn’t Uruguay’s Rio de la Plata doesn’t participate. Considering government statisticians estimate this firm accounts for one-fifth of online sales in the UK, this is … kind of a big omission. Especially so considering online retailing is gaining an ever-larger market share.
Meanwhile, the ONS’s survey is broader and mandatory. Every month, “approximately 900 large and 4,100 small-to medium-sized retailers are selected using stratified random sampling.”[i] That makes it a closer look at the broader UK retail scene, which is heavy on small businesses and local shops, while the BRC’s measure might be most useful for those analyzing the UK stock market’s Consumer Staples and Consumer Discretionary sectors. It also emphasizes food retailing more than the ONS measure does, making it helpful for those tracking the career prospects of Jamie Oliver and Gordon Ramsay.
We love having an abundance of data, and no metric is perfect. This is why we also like looking at other indicators, including Barclaycard’s and Visa’s estimates of consumer spending and the Confederation of British Industry’s numbers. The more, the merrier! But it is important to understand the inputs, especially when they diverge, lest one weakly constructed metric shift your perception of the economy.
Not that any of these are predictive for stocks—all are backward-looking, like all economic data. Results simply show how data square with expectations. Plus, retail sales measures omit most spending on services, which happens to be the bulk of UK consumer spending (US, too). So whether the results were good or bad, we wouldn’t get hung up on them. Just enjoy the occasionally interesting results, and then move on.
[i] “Retail Sales Index and External Indicators: Assessing Methodological Differences With the BRC-KPMG UK Retail Sales Monitor,” Andreas Mastrosavvas and Rhian Murphy, Office for National Statistics, March 22, 2018.
If you would like to contact the editors responsible for this article, please message MarketMinder directly.
*The content contained in this article represents only the opinions and viewpoints of the Fisher Investments editorial staff.
Get a weekly roundup of our market insights
Sign up for our weekly e-mail newsletter.

You Imagine Your Future. We Help You Get There.
Are you ready to start your journey to a better financial future?

Where Might the Market Go Next?
Confidently tackle the market’s ups and downs with independent research and analysis that tells you where we think stocks are headed—and why.
Related Resources
-
Expert Commentary US Inflation, Fed Minutes, Consumer Sentiment | 3 Things You Need to Know This Week
 2026-04-06
 -
Weekly Wrap-Up Fisher Investments Reviews: Last Week in Markets—March 30 - April 32026-04-06
-
Expert Commentary This Week in Review | Q1 Recap, Earnings Guidance, Elections
 2026-04-03
 -
Market Analysis A Forward-Looking Lesson One Year After Liberation Day2026-04-02


Learn More
Learn why 200,000 clients trust us to manage their money and how Fisher Investments and its affiliates may be able to help you achieve your financial goals.
As of 3/31/2026
New to Fisher? Call Us.
Contact Us Today