


Personal Wealth Management / Economics
A World Trade Check-In Starring Southeast Asia
A look at Southeast Asian trade to weigh the factors that have contributed to making tariffs much less of a drag than many expected.

After April 2025’s “Liberation Day” announcements of lofty statutory tariff rates, we saw three main scenarios as potential outcomes: 1) Tariffs prove illegal and unenforceable, 2) tariffs drive a flurry of dealmaking, and 3) countries coordinate retaliation, with only the latter leading to negative stock market consequences. But we soon saw another unfolding: 4) Non-US trade expands in response to US protectionism. While China and Canada have retaliated, with talks about easing the former again stealing headlines amid last week’s summit, the extent is limited. Meanwhile, scenarios 1, 2 and 4 far outnumber and outweigh scenario 3. You may not know it from the news, but the global trade picture remains far brighter than feared—and is getting freer as we type.
Most notably, last Tuesday the EU struck a free-trade agreement with the Philippines. Although nothing earthshattering on its own, it follows EU deals with Vietnam and Indonesia. And talks with Malaysia and Thailand are seemingly close to conclusion. All these add up, which underscores scenario 4. EU goods trade with Southeast Asia is “at an all-time high,” reaching €276 billion in 2025, up 55% from 2016—and set to move higher with the agreements it is negotiating, which includes services and investment, not just goods.[i] Rather than raising trade barriers in response to American tariffs, the EU is overall pushing for deals with many non-US nations. That isn’t true across the board, naturally, as talk of measures against Chinese “dumping” simmer. But generally, the direction of travel is toward freer trade.
And that is just the EU. As Exhibit 1 shows, using 2024 as the pre-Liberation Day baseline, global non-US trade has grown over $2.6 trillion, much more than America’s $473 billion, driving total world trade volumes to record highs.
Exhibit 1: Goods Trade Growth vs. 2024 Total
Source: Macrobond, as of 9/28/2026. (Hat Tip: Fisher Investments Research Specialist Daniel Slavin.)
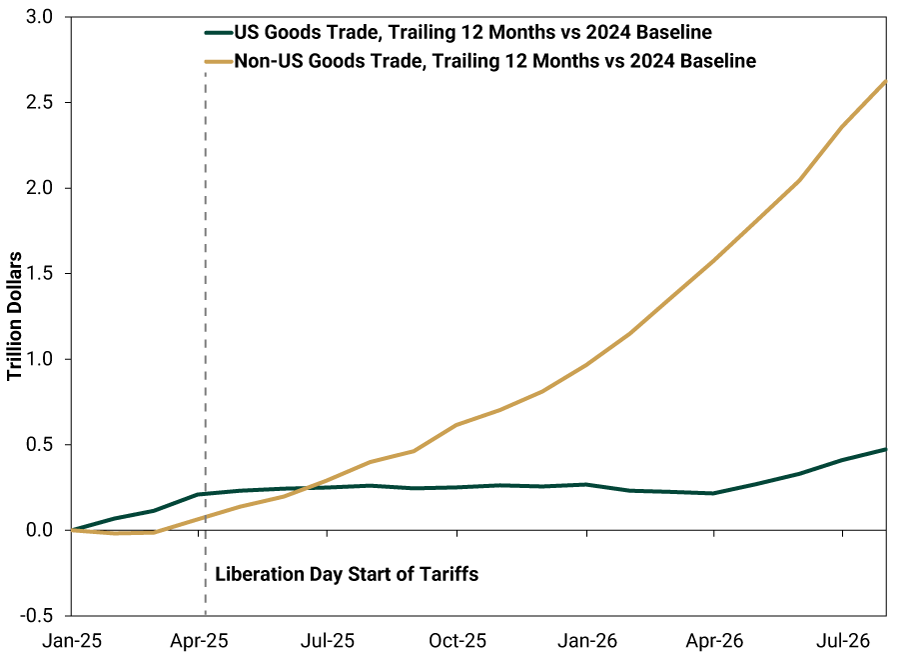
While less rapid, US goods trade is still climbing, too, despite tariffs. This speaks to scenario 2: America’s deals. Vietnam is reportedly “very close” to an agreement with the US, as President To Lam pledged to buy more American aircraft, transportation infrastructure and nuclear power.[ii] This seeks to lower barriers on US imports from Vietnam, providing further relief, and could yet yield a 0% reciprocal rate for at least some Vietnamese imports (from 20% currently).
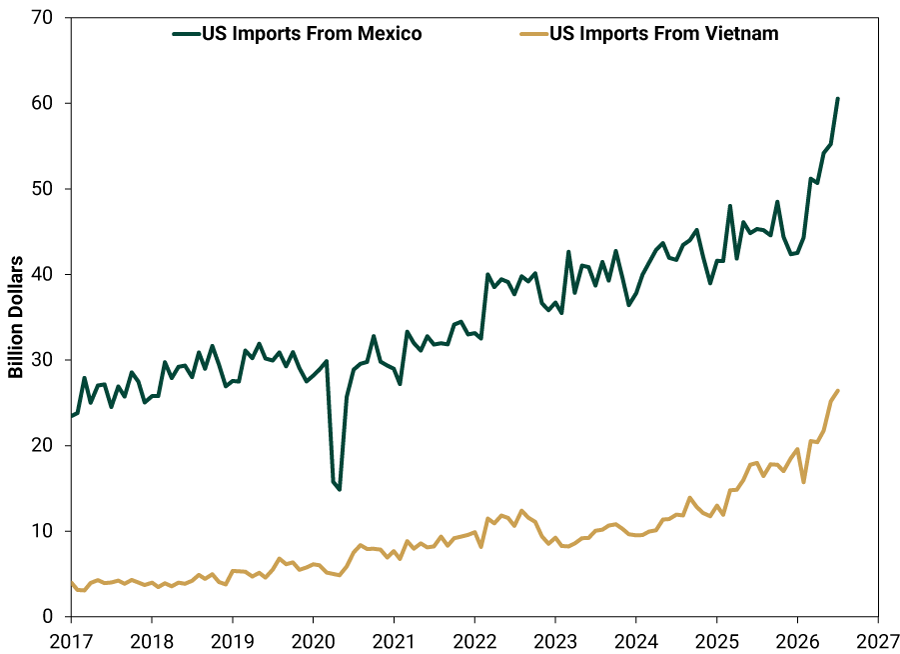
In turn, Vietnam would provide preferential access for US exports, “removing tariffs on almost all goods,” including agricultural, industrial and pharmaceutical products.[iii] It would also open Vietnam to US investment, particularly for energy (like liquefied natural gas) and power generation. In the meantime, even without a deal, US imports from Vietnam have more than doubled over the last two years.
Exhibit 2: America’s Imports Are Soaring From Vietnam and Mexico
Source: FactSet, as of 9/28/2026. Note: Series aren’t seasonally adjusted.
Coincidentally (or not), Chinese exports to Vietnam have hit record highs. (Exhibit 3) This raises a thorny issue: Transshipping—re-exporting goods that originate from another country, like China, with higher statutory tariff rates. President Lam denies there is any transshipment of Chinese goods through Vietnam. But “rules of origin” can be fiendishly hard to detect—much less enforce. So while America and Vietnam have committed to “addressing duty evasion and cooperating on export controls and investment security,” it remains to be seen how—or even if—any deal could address that.[iv] This shows scenario 1 at work: Trade barrier workarounds, in practice, appear to be flourishing, tied to the extreme difficulty in actually enforcing sweeping tariffs.
Exhibit 3: China’s Exports Are Soaring to Vietnam and Mexico
Source: FactSet, as of 9/28/2026. Note: Series aren’t seasonally adjusted.
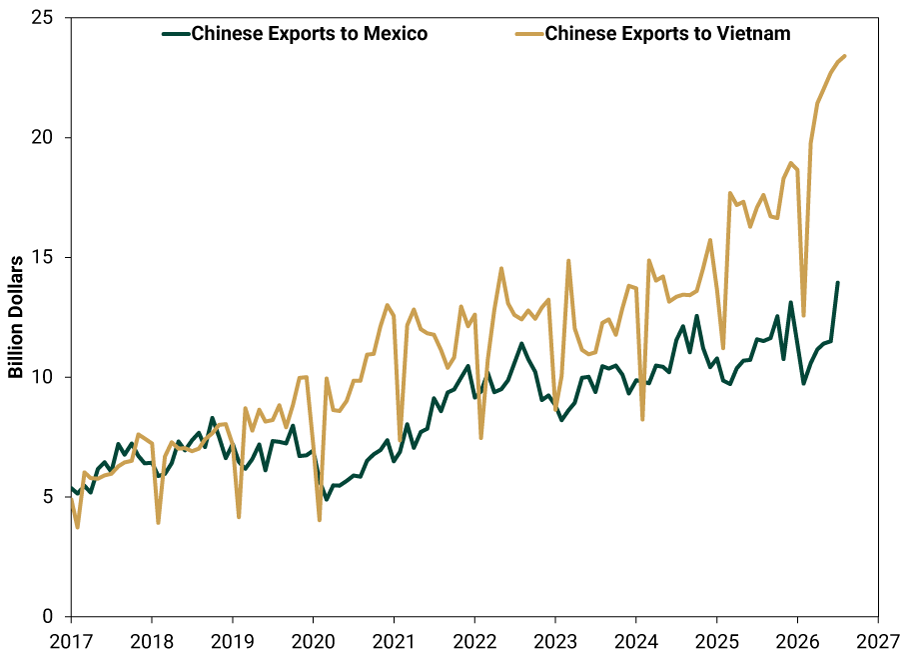
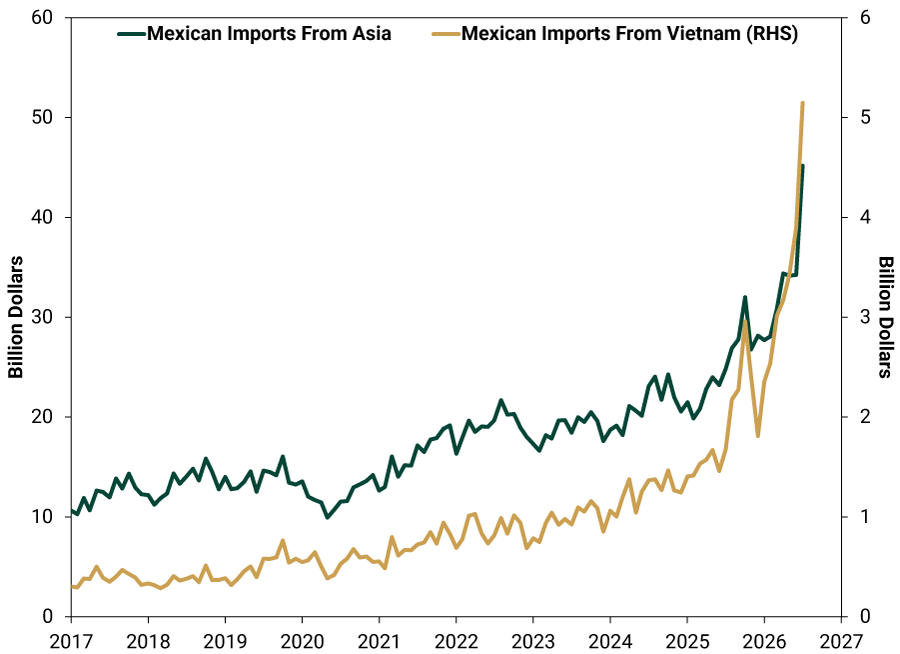
Meanwhile, as Exhibits 2 & 3 also show, Vietnam isn’t the only country exporting more to America: Mexico’s US exports have also leapt—alongside record-high Chinese exports to Mexico. Not only that, Exhibit 4 shows Mexican imports from Vietnam—and Asia generally—accelerating upward, too. With around 80% of US imports from Mexico exempt from tariffs under the US-Mexico-Canada Agreement (USMCA, NAFTA’s successor), up from under 50% in 2024, it seems more global goods are entering America tariff free—even with stricter rules of origin.[v] Apparently, whatever “assembly” occurs in Mexico passes official muster. This is all happening despite alleged “friction” gumming up global trade.
Exhibit 4: Mexico’s Imports Are Soaring From Asia
Source: FactSet, as of 9/28/2026. Note: Series aren’t seasonally adjusted.
The latest trade news out of Southeast Asia and Mexico shows the tariff scenarios that began unfolding in early 2025 are playing out bullishly. Tariffs are always an economic negative, but there are many ways the global economy can adapt and respond, as the period since April 2025 shows in spades.
[i] “EU Finally Clinching Trade Deals With Southeast Asian States,” David Hutt, Deutsche Welle, 9/24/2026. “EU Trade Relations with Association of South East Asian Nations (ASEAN),” Staff, European Commission, 5/22/2026.
[ii] “Vietnam Leader Says US Trade Deal Close, Denies Re-Routing China Goods,” Francesca Stevens, Nguyen Dieu Tu Uyen, Nguyen Xuan Quynh and Haslinda Amin, Bloomberg, 9/22/2026.
[iii] “Fact Sheet: The United States and Viet Nam Reach a Framework for an Agreement on Reciprocal, Fair, and Balanced Trade,” Staff, Office of the United States Trade Representative, October 2025.
[iv] Ibid.
[v] “USMCA Has Strengthened Economic Integration in North America,” Brendan Kelly, Jesus Cañas and Luis Bernardo Torres Ruiz, Brookings, 3/4/2026. “How USMCA Compliance Cushioned the 2025 Tariff Shock,” Enrique Martínez García and Ron Mau, Federal Reserve Bank of Dallas, 8/4/2026.
If you would like to contact the editors responsible for this article, please message MarketMinder directly.
*The content contained in this article represents only the opinions and viewpoints of the Fisher Investments editorial staff.
Get a weekly roundup of our market insights
Sign up for our weekly e-mail newsletter.

You Imagine Your Future. We Help You Get There.
Are you ready to start your journey to a better financial future?
Where Might the Market Go Next?
Confidently tackle the market’s ups and downs with independent research and analysis that tells you where we think stocks are headed—and why.
Related Resources
-
Market Analysis Reader Mailbag: September 20262026-09-30
-
Behavioral Finance Low Vibes Aren’t Keeping America’s Economy Down2026-09-29
-
Market Analysis Putting Faster Money Supply Growth in Context2026-09-29
-
Expert Commentary 3 Things You Need to Know This Week | US Jobs, Global Inflation, Midterm Miracle
 2026-09-28




Learn More
Learn why 210,000 clients trust us to manage their money and how Fisher Investments and its affiliates may be able to help you achieve your financial goals.
As of 6/30/2026
New to Fisher? Call Us.
Contact Us Today