Personal Wealth Management / Economics
America’s Pristine Balance Sheet
Scouring through the US's balance sheet finds little to worry over.

In our view, America's balance sheet is similarly clean. (Photo by Jurgute/iStock by Getty Images.)

Mention "balance sheet" anywhere but an accounting cocktail party and you risk Snooze-a-Palooza. So rest assured, this article is not about America's balance sheet. Rather, it's about a perhaps quirky way to put investors' lingering debt fears in context. Debt-to-GDP ratios have their uses, but measuring a level (debt) against a flow of economic activity (GDP) isn't keeping like with like. Better, in our view, to weigh debt against assets and see what shakes out-just like a bank would. Do so, and it becomes clear investors needn't fear US debt-whether household, corporate or government-sinking stocks.
Let's start with US households, supposedly threatened by surging student and auto debt. Total household debt increased $146 billion in Q2 to $15.2 trillion-up almost half a trillion dollars since Q2 2016.[i] But household assets rose over 10 times more-up $1.8 trillion in Q2 and $8.7 trillion since last year![ii] Household assets now stand above $111 trillion, dwarfing liabilities.[iii] Now, there is an obvious rebuttal: What if the people with rising debt aren't the people with soaring assets? And it's true, averages obscure extremes. But mortgages make up the bulk of household debt (73.2%), and banks' tighter mortgage standards during this expansion are pretty legendary. As the now-old joke said, for a long time, you couldn't get a mortgage unless you didn't need one. Mortgage loans comprise less than half of household debt's total rise since its Q2 2013 bottom. Another gauge of residential real estate loans' health is homeowners' percentage of equity. During and shortly after the financial crisis, this dipped below 50%, a first. It has now recovered back to 58.4%, its highest level since Q1 2006 during the housing boom,[iv] as house prices nationally make record highs.[v]
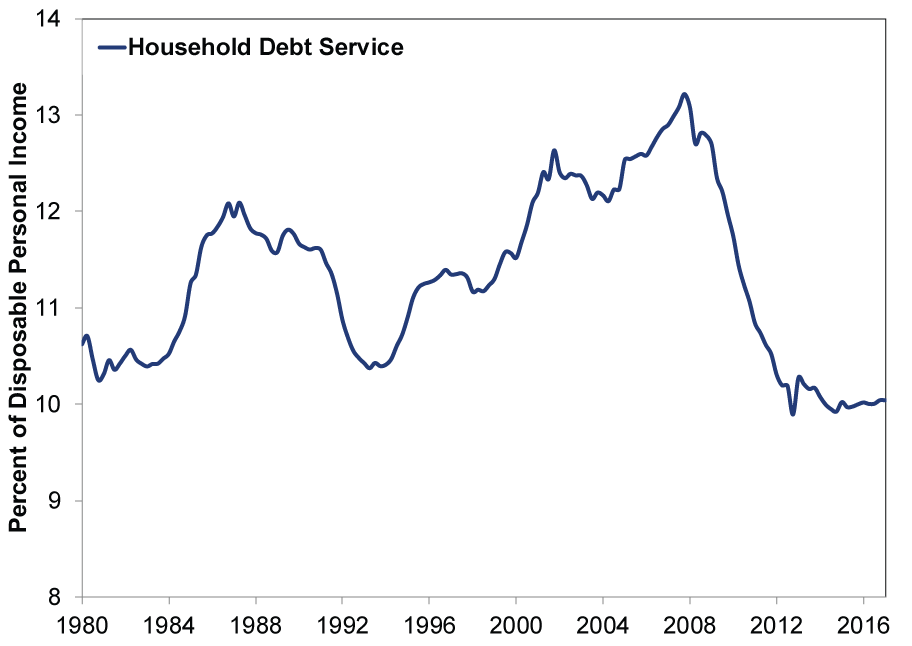
As for faster-rising student, auto and credit card debt, we are talking about 1.2%, 1.1% and 0.7%, respectively, of total household assets. While there are some people saddled with six-figure student loans and unpayable subprime auto loans, these aren't representative of the broader market. The median student loan balance is $17,000, owed by college grads with well-paying jobs. Credit card debt also gets attention, but most of the increase since 2008 stems from accounting rule changes, and there is no evidence higher credit card balances are an economic driver. Not coincidentally, household debt service-interest payments relative to income-is near record lows and, since 2012, is below any point in the prior three decades.
Exhibit 1: Household Debt Affordable
Source: Federal Reserve Bank of St. Louis, as of 9/22/2017. Household Debt Service Ratio, Q1 1980 - Q1 2017.
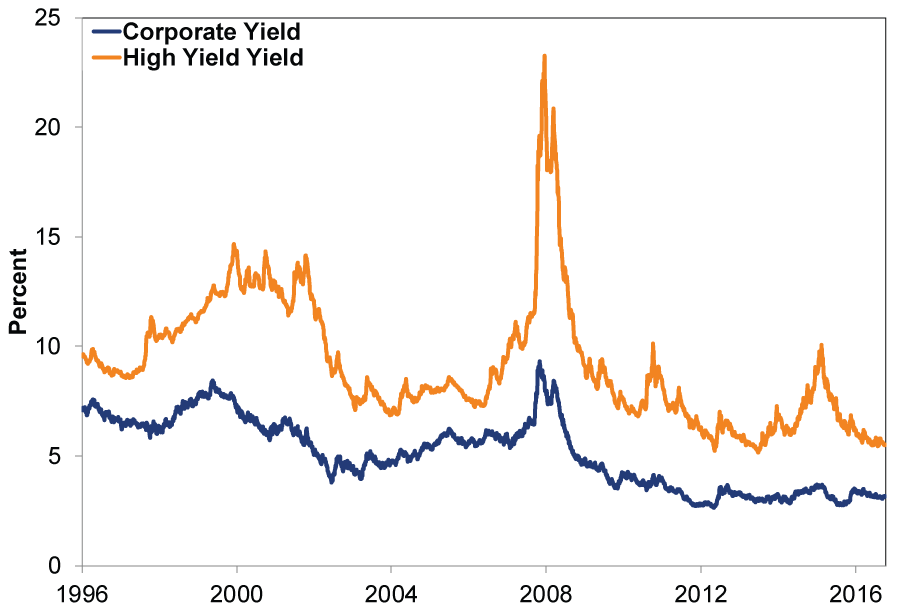
Nonfinancial corporate business liabilities increased $204 billion last quarter and rose $830 billion from last year to a record high $19.1 trillion.[vi] But again, it's impossible to tell whether this is onerous or not without proper scaling. Nonfinancial corporate businesses' assets rose $830 billion in Q2 alone and $2.7 trillion over the last year. They're also at a record high and over twice liabilities at $42.4 trillion.[vii] Once again, there is the question of who holds what. But diversified indexes of corporate bond yields-for investment grade debt and higher risk "junk" bonds-take into account various classes of borrowers and their market weightings. Yields and their spreads above lower-risk Treasurys are near record lows, suggesting minimal Corporate America credit risk. (Exhibit 2) Markets may be wrong of course, but it isn't likely when they incorporate all widely known information. That is, US corporations are flush with cash and have been meeting their financial obligations by and large. Moreover, default rates-even among high-yield issuers-are far below levels seen in early 2016, when very low quality Energy firms squeezed by oil below $30 per barrel failed to service debt.
Exhibit 2: Corporate Bond Yields Near Lows
Source: Federal Reserve Bank of St. Louis, as of 10/6/2017. BofA Merrill Lynch US Corporate Master Effective Yield and BofA Merrill Lynch US High Yield Effective Yield, 12/31/1996 - 10/5/2017.
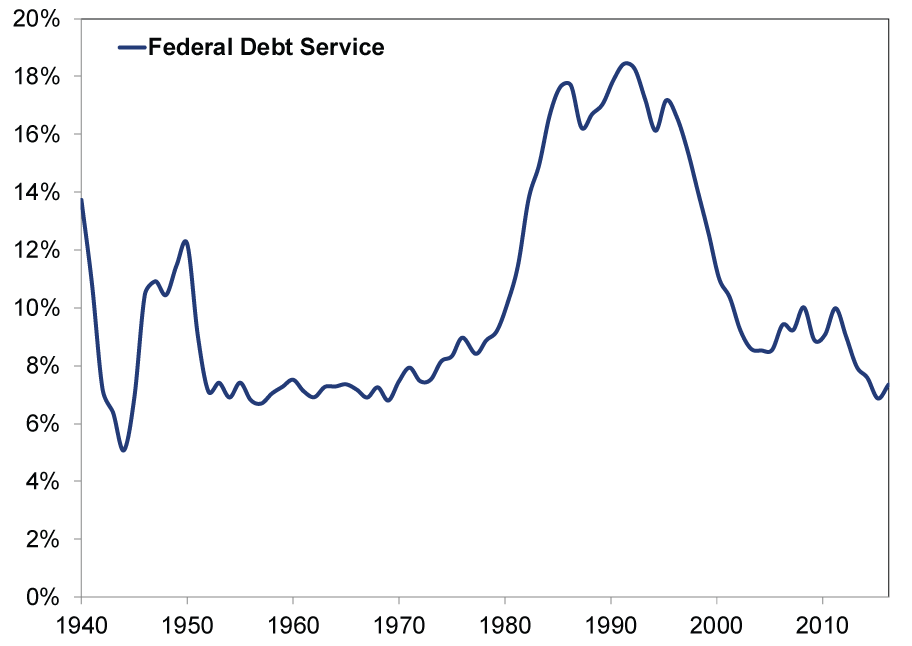
In September, US federal government debt crossed $20 trillion, garnering headlines. But again proper context is necessary. For one, it refers to gross debt. Net debt, which excludes money the government owes itself, is a more benign $14.6 trillion. (Net debt includes the Fed's holdings, as it is technically a private institution.) Treasury's interest payments relative to tax receipts are now around 7.3%, less than half 1980s and 1990s levels.[viii] Not that the US was in danger of defaulting then, just that concerns are even more misplaced now.
Exhibit 3: Federal Debt Service Near 50-Year Lows
Source: Federal Reserve Bank of St. Louis, as of 9/22/2017. Annual interest outlays on Federal debt divided by Federal receipts, 1940 - 2016.
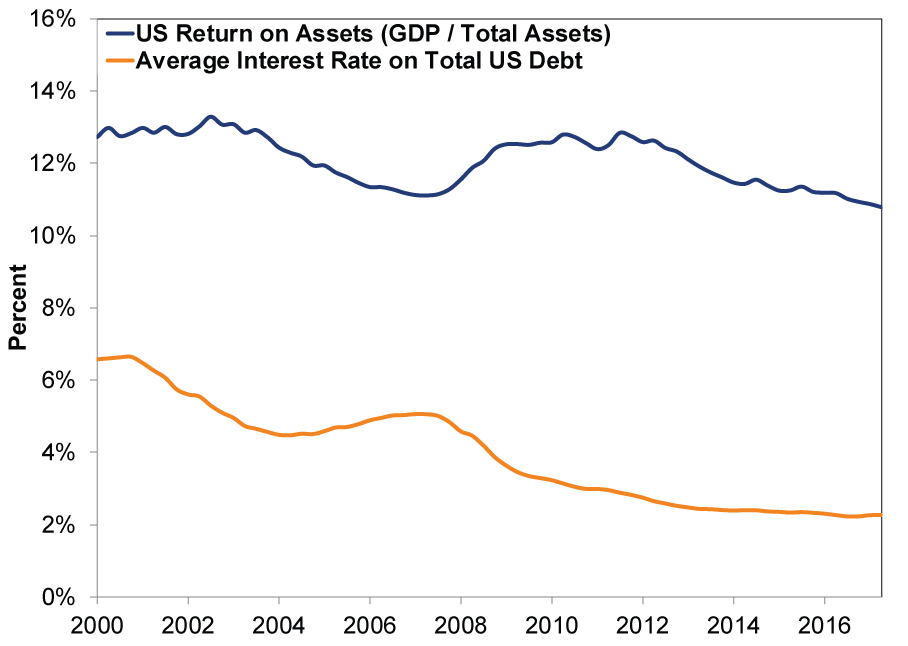
To see why the US isn't over-indebted, Ken Fisher in The Only Three Questions That Still Count constructs the "Aggregate Hard Asset Balance Sheet of the United States." Roughly speaking, add up the US's assets (financial and tangible). Then calculate the US's return on those assets; take US total income (GDP) and divide by total assets. As of Q2, it's about 10.8%-and that excludes impossible-to-value assets like National Parks.[ix] Compare that to the US's borrowing costs like a good CFO would. The appropriate level of debt is the amount where marginal borrowing costs equal marginal return on assets. Today, the average interest rate for all US debt is 2.3%,[x] a fifth of America's return on assets!
Exhibit 4: The US Can Afford a Lot More Debt
Source: Federal Reserve, Bureau of Economic Analysis and TreasuryDirect, as of 9/26/2017. US Return on Assets = Nominal GDP divided by Total Assets (Domestic nonfinancial sectors; total financial assets + Households and nonprofit organizations; nonfinancial assets + Nonfinancial corporate business; nonfinancial assets + Nonfinancial noncorporate business; nonfinancial assets) and Average Interest Rate on Total Interest-bearing Debt, Q1 2000 - Q2 2017.
If anything, the US is under-indebted! Yet widespread conventional wisdom believes America is being crushed under unsustainable debt loads when it's rarely been easier to pay for that debt-because the assets backing it tower over the nation's liabilities and generate much more income than it costs to service. Stocks move on the difference between sentiment and reality, and the current wide gulf between the two suggests positive surprises for markets well into the future as debt problems fail to materialize.
[i] Source: Federal Reserve, as of 9/21/2017.
[ii] Ibid.
[iii] Ibid.
[iv] Ibid.
[v] The July S&P/Case-Shiller National House Price Index is 3.8% above its bubble peak and 40.3% above its post-bubble low.
[vi] Source: Federal Reserve, as of 9/21/2017.
[vii] Ibid.
[viii] Source: Federal Reserve Bank of St. Louis, as of 9/22/2017.
[ix] Source: Federal Reserve and Bureau of Economic Analysis, as of 9/26/2017. US Return on Assets = Nominal GDP divided by Total Assets (Domestic nonfinancial sectors; total financial assets + Households and nonprofit organizations; nonfinancial assets + Nonfinancial corporate business; nonfinancial assets + Nonfinancial noncorporate business; nonfinancial assets), Q1 2000 - Q2 2017.
[x] Source: TreasuryDirect, as of 9/26/2017. Average Interest Rate on Total Interest-bearing Debt, January 2000 - August 2017.
If you would like to contact the editors responsible for this article, please message MarketMinder directly.
*The content contained in this article represents only the opinions and viewpoints of the Fisher Investments editorial staff.
Get a weekly roundup of our market insights
Sign up for our weekly e-mail newsletter.

You Imagine Your Future. We Help You Get There.
Are you ready to start your journey to a better financial future?

Where Might the Market Go Next?
Confidently tackle the market’s ups and downs with independent research and analysis that tells you where we think stocks are headed—and why.
Related Resources
-
Market Analysis On the June Inflation Cooldown2026-07-14
-
Expert Commentary 3 Things You Need to Know This Week | US Inflation, China GDP, US Retail Sales
 2026-07-13
 -
Weekly Wrap-Up Fisher Investments Reviews: Last Week in Markets—July 6 - July 102026-07-13
-
Expert Commentary This Week in Review | Global PMIs, SpaceX, RMD Planning
 2026-07-10


Learn More
Learn why 210,000 clients trust us to manage their money and how Fisher Investments and its affiliates may be able to help you achieve your financial goals.
As of 6/30/2026
New to Fisher? Call Us.
Contact Us Today