Personal Wealth Management / Market Analysis
Chart of the Week: Surprise!
Citigroup’s US Economic Surprise Index illustrates how wide the gap between expectations and reality has been lately.

Wednesday morning, the US Commerce Department released the July tally of durable goods orders (products and materials aimed to last more than three years). The results? Orders grew for the third straight month, rising 11.2% m/m and smashing expectations for 4.8%. Pundits often make much of durables orders, calling them a proxy for business investment. We think that goes too far. But lately, almost no matter what economic series you look to, the results are blowing pessimistic pundits’ predictions out of the water.
To see this, our Chart of the Week[i] plots Citigroup’s US Economic Surprise Index. This series attempts to quantify the degree to which economic data are beating or missing expectations. When the line is above zero, data are broadly beating expectations—and vice versa. As Exhibit 1 shows, recent data are beating estimates to an extent unseen in the gauge’s 17-year history.
Exhibit 1: Citi US Economic Surprise Index
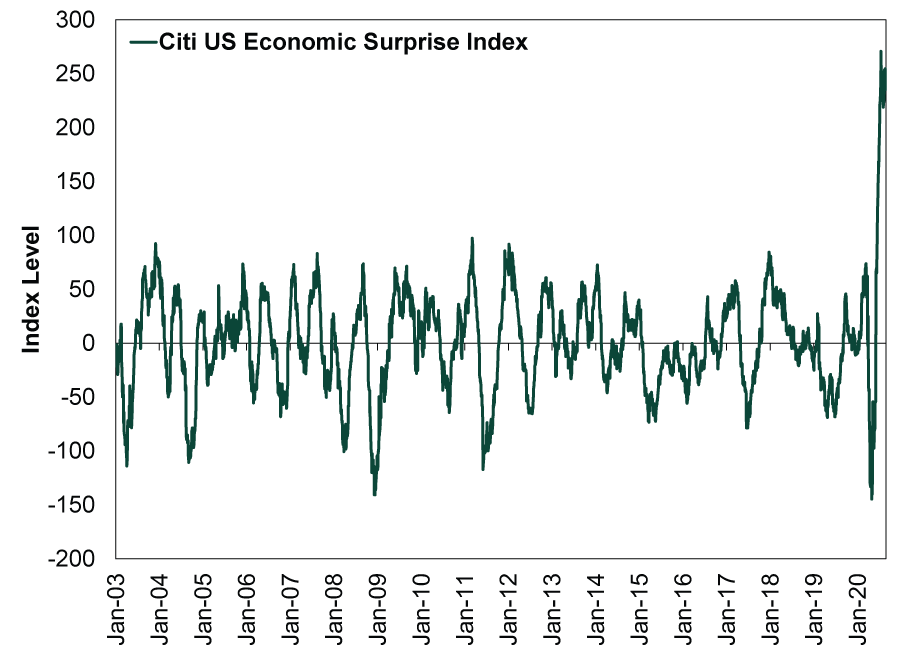
Source: FactSet, as of 8/27/2020. 1/1/2003 – 8/26/2020.
Of course, this measure doesn’t perfectly reflect sentiment, as it uses professional forecasts only. Sentiment is much broader than that, including individual investors, institutions, professionals that don’t share forecasts publicly, financial pundits and media and more. But it does provide an excellent illustration of how the gap between sentiment and reality can sway markets significantly. Back in the spring, the series was plunging to a record low it set in April. But then rampant pessimism overshot. Expectations fell too far, lowering the bar reality had to clear to surprise. That, in our view, is what kicked off this bull market—and the record positive surprise since is likely why stocks are back at all-time highs just five months after February and March’s bear market ended.
If you would like to contact the editors responsible for this article, please message MarketMinder directly.
*The content contained in this article represents only the opinions and viewpoints of the Fisher Investments editorial staff.
Get a weekly roundup of our market insights
Sign up for our weekly e-mail newsletter.

You Imagine Your Future. We Help You Get There.
Are you ready to start your journey to a better financial future?

Where Might the Market Go Next?
Confidently tackle the market’s ups and downs with independent research and analysis that tells you where we think stocks are headed—and why.
Related Resources
-
Market Analysis The New Tariffs in Town Are Still Old News2026-07-24
-
Expert Commentary This Week in Review | Market Volatility, Tariffs, SpaceX
 2026-07-24
 -
Expert Commentary Why Ken Fisher Is Optimistic About European Stocks
 2026-07-23
 -
Economics A Summertime Check-in on US Consumers2026-07-23


Learn More
Learn why 210,000 clients trust us to manage their money and how Fisher Investments and its affiliates may be able to help you achieve your financial goals.
As of 6/30/2026
New to Fisher? Call Us.
Contact Us Today