Personal Wealth Management / In The News
Digging Into the CBO’s Debt Forecasts
Long-term forecasts are only as good as their inputs.

Sometimes, when the Congressional Budget Office (CBO) releases its latest 10-year budget projections, headlines’ debt freakout is instant and widespread. And sometimes, apparently, the news simmers on the backburner for a few weeks before the CBO director’s Congressional testimony amps up a frenzy before a long weekend. We seem to have gotten the latter this time around, with all eyes on projected debt service payments, which CBO Director Phillip Swagel said, “pose a risk to our economic stability.” That unleashed a number of articles assessing the projected $1 trillion increase in annual debt interest costs over the next decade and wondering how the heck Uncle Sam will pay for it. To us, it is much ado over a long-term forecast with a long history of proving incorrect. And to markets, it is very likely a sideshow.
First, let us give credit where due and congratulate everyone for at least talking about debt service costs rather than the total amount of debt outstanding. The latter usually gets all the ink because it is a bigger, scarier number. But interest costs are what actually matter because, in conjunction with tax revenues, they determine whether debt is affordable.
The CBO projects the Treasury will face a test on this front, with interest costs relative to revenues rising through 2034. Exhibit 1 illustrates this, tacking the projections onto the actual results since 1940, when the data begin. If the CBO is right about interest and revenues, the debt service burden would hit a new record in 2025 and keep on rising, hitting 21.8% in 2034. This would put the Treasury’s pocketbook in uncharted territory, but it wouldn’t be unique on a global basis. Italy, for one, had far higher debt service costs in the late 20th century, with no debt crisis. And US interest costs got rather high in the late 1980s and early 1990s, which turned out to be the precipice of an economic and stock market boom.
Exhibit 1: Actual and Projected Debt Service Costs
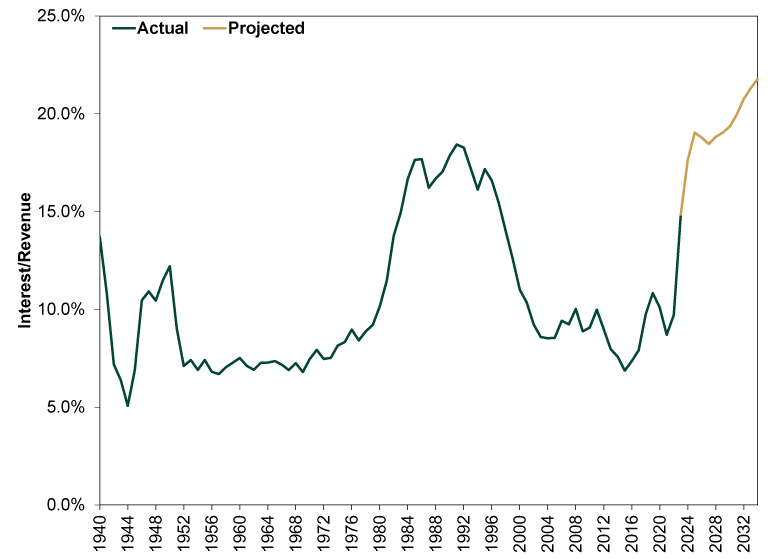
Source: St. Louis Federal Reserve and Congressional Budget Office, as of 2/16/2024. Fiscal-year interest payments and tax revenues, 1940 – 2023 (actual) and 2024 – 2034 (projected).
Yet in our view, projections are only as good as their inputs and the back of the envelope they are calculated on. The CBO’s have a long history of being wrong, largely because they tend to emphasize the recent past and pencil in historical average interest rates. Rather than making detailed economic forecasts, they use a lot of straight-line math. We point this out not to pooh-pooh the CBO or its personnel, who we reckon are mighty fine people. But the projections’ purpose is chiefly political. They guide lawmakers’ fiscal policy negotiations and put a leash on spending and borrowing, at least in theory.[i] Basing their projections on the premise that economic conditions and interest rates will revert to historical averages over time helps them maintain political neutrality. But it often doesn’t match real-world conditions, and it can’t incorporate unforeseen changes like, say, big COVID-related spending or a tax cut package.
In this case, the interest cost forecasts hinge on the CBO’s expectation of high interest rates over the next decade. It pencils in an average 4.6% 10-year US Treasury yield and 4.9% 3-month yield this year. The 10-year stays at an average of 4.6% next year before dropping to 3.9% in 2026 and 3.8% in 2027 and 2028 before rising to average 4.1% in 2029 – 2033. Meanwhile, the 3-month yield is projected to ease to 3.8% next year, 3.1% in 2026, 2.7% the ensuing two years, and finally average 2.8% from there through 2034.
So logically, one might ask, what is the CBO’s record of accurate rate projections? Well, not so hot. Exhibits 2 and 3 rewind a decade to the 2014 projections of 10-year and 3-month rates, which we compared to what actually happened. Yes, we give you permission to chuckle at their being coincidentally right for like two days.
Exhibit 2: February 2014’s 10-Year Treasury Yield Forecast Whiffed
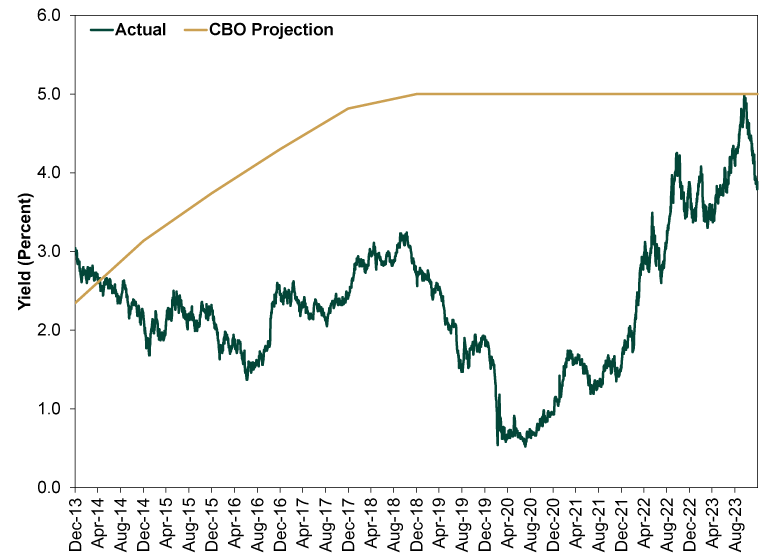
Source: FactSet and Congressional Budget Office, as of 2/16/2024. 10-year constant maturity US Treasury yield and annual rate forecasts, 12/31/2013 – 12/31/2023.
Exhibit 3: So Did February 2014’s 3-Month Treasury Yield Forecast
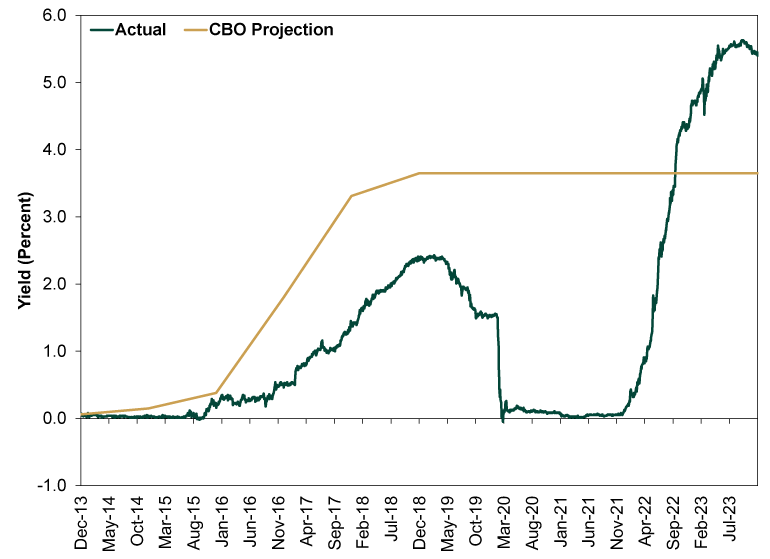
Source: FactSet and Congressional Budget Office, as of 2/16/2024. 3-month constant maturity US Treasury yield and annual rate forecasts, 12/31/2013 – 12/31/2023.
We would also be remiss not to point out that 10 years ago, the CBO projected interest costs would hit $819 billion (17.4% of projected revenue) last year. The actual tally? $659 billion and 14.8% of revenue, and that is with the big pandemic aid-related bump no one saw coming in 2014. Even with an unforeseen, huge one-off affecting the totals, the CBO’s forecasts overshot by a wide margin.
Granted, there is no way to know for sure if the CBO is overshooting similarly now. But we do know reality rarely follows the straight line their forecasts use, and it wouldn’t take much for costs to end up lower than they project. Lower-than-forecast interest rates would do it. So would faster-than-projected GDP and income growth, which would help on the revenue side. Tax policy is another wildcard, as is Congress’s spending habits. All are big unknowns and could go either way.
But it is all unforeseeable now, which is why debt doesn’t bother markets. Stocks look only about 3 – 30 months out, and within that window, a looming debt spiral doesn’t look realistic. Endlessly piling on debt and interest costs wouldn’t be great, but that is a far-future possibility, impossible to calculate probabilities for today, and markets don’t move on possibilities. They move on probabilities within the foreseeable future, and regardless of how right the CBO ends up several years from now, with interest rates mostly moving sideways and the average debt maturity at nearly six years, the overwhelming likelihood is that debt service stays plenty affordable within the foreseeable future.[ii]
If you would like to contact the editors responsible for this article, please message MarketMinder directly.
*The content contained in this article represents only the opinions and viewpoints of the Fisher Investments editorial staff.
Get a weekly roundup of our market insights
Sign up for our weekly e-mail newsletter.

You Imagine Your Future. We Help You Get There.
Are you ready to start your journey to a better financial future?

Where Might the Market Go Next?
Confidently tackle the market’s ups and downs with independent research and analysis that tells you where we think stocks are headed—and why.
Related Resources
-
Weekly Wrap-Up Fisher Investments Reviews: Last Week in Markets—July 6 - July 102026-07-13
-
Expert Commentary 3 Things You Need to Know This Week | US Inflation, China GDP, US Retail Sales
 2026-07-13
 -
Expert Commentary This Week in Review | Global PMIs, SpaceX, RMD Planning
 2026-07-10
 -
Market Analysis Trim Your Angst on Economic Measurement Tweaks2026-07-09


Learn More
Learn why 210,000 clients trust us to manage their money and how Fisher Investments and its affiliates may be able to help you achieve your financial goals.
As of 6/30/2026
New to Fisher? Call Us.
Contact Us Today