Personal Wealth Management / Market Analysis
'It Ain't Over Till It's Over'
When determining whether a stock market correction is over, take Yogi Berra’s old quote to heart.

The S&P 500 Price Index closed Tuesday up 6.3% from its February 8 low, a little more than halfway back to January 26’s high.[i] But Tuesday also happened to be a volatile day, with the S&P 500 falling -1.3%, making this a good time to remind readers we may not have seen the end of the correction.[ii] Headlines and pundits seem fairly upbeat about stocks’ prior two weeks, and we have seen many discussing the correction in past tense. We hope they are correct, and we still expect a great year for stocks in 2018. But to us, it is premature to declare the correction over—a viewpoint we would have even if stocks rose 1.3% today. Volatility can resurge at any time, for any or no reason, and double-bottom corrections aren’t abnormal. Again, we are bullish! But we think it is important for investors to have reasonable expectations.
The following charts show the S&P 500 during bull markets since 1980—four complete cycles, plus the current—with the index price level plotted in a logarithmic scale to make percentage changes more visible. As you will see, each featured a correction (light green shading) or pullback (light yellow shading) with some false starts toward recovery. Sometimes, stocks got nearly back to breakeven before dipping again. Other times, they came only partway back before testing new lows.
We highlight these not to freak you out—rather, to help you keep an even keel if today’s dip turns out to be the start of another leg down. We don’t know whether it will—short-term sentiment swings can’t be forecast, in our view. But volatility is normal, and there is no such thing as an all-clear signal. Investors lulled into complacency by cheerful the correction is over talk risk getting blindsided by a potential double bottom, and the surprise could trigger ill-timed trading. Reacting to a market that doesn’t do exactly what you (or headlines) expect is all too human. But if stocks take another tumble before recovering for real, it shouldn’t mean the market is weak, broken or what have you. In our view, it probably just means the market is being its wobbly self—a pesky trickster that enjoys whipsawing people in the short term. So make Yogi Berra’s famous quote your correction mantra: “It ain’t over till it’s over.” When stocks rally back to surpass pre-correction levels, it will be over. Otherwise, expect volatility and swings.
This is why we encourage investors to keep a longer perspective when volatility strikes. Instead of stressing every wobble, think critically about whether anything fundamental has deteriorated. In our view, nothing has. Leading economic indicators like the yield curve, the new orders component of major purchasing managers’ indexes and The Conference Board’s Leading Economic Index still point positively. Governments throughout the developed world are still gridlocked, limiting political risk. There haven’t been sweeping regulatory shifts. Trade spats exist, but they are small and focused on niche industries. Monetary policy isn’t perfect globally, but no big central bank appears close to making a big blunder that would invert the yield curve.
So, absent a fundamental reason (as far as we can see) to think another downdraft is the start of a bear market, stay cool. Riding bull markets’ ups and downs is part and parcel of investing. Volatility is the price we pay for stocks’ great long-term bull market returns. In our view, not letting volatility scare you out of the market is key to earning those returns in your portfolio and staying on track toward your financial goals.
Exhibit 1: Double Dips in the 1982 – 1987 Bull
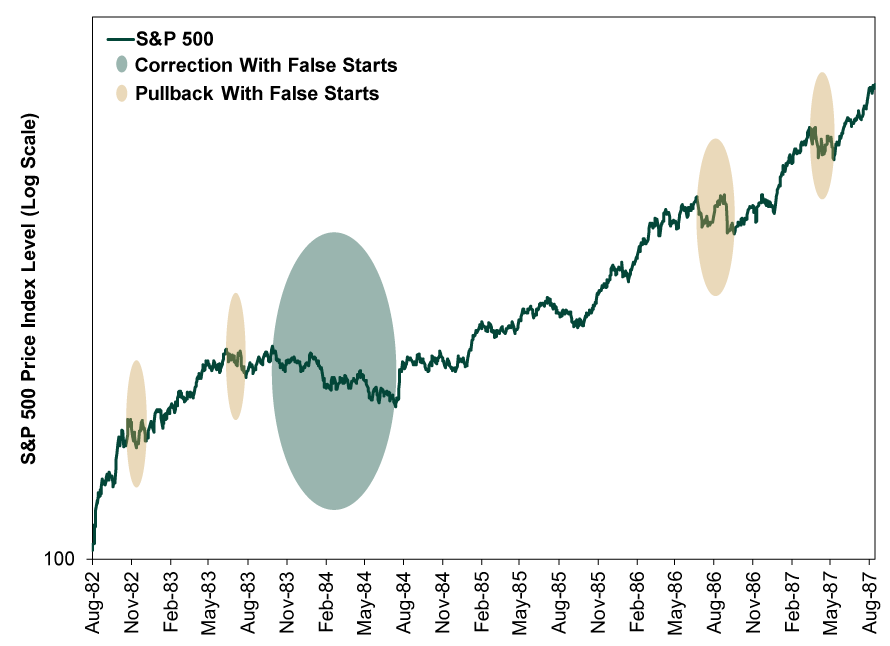
Source: FactSet, as of 2/27/2018. S&P 500 Price Index, 8/12/1982 – 8/25/1987. Correction defined as a drop of -10% or greater. Pullback defined as a drop of 6% or greater.
Exhibit 2: Double Dips in the 1987 – 1990 Bull
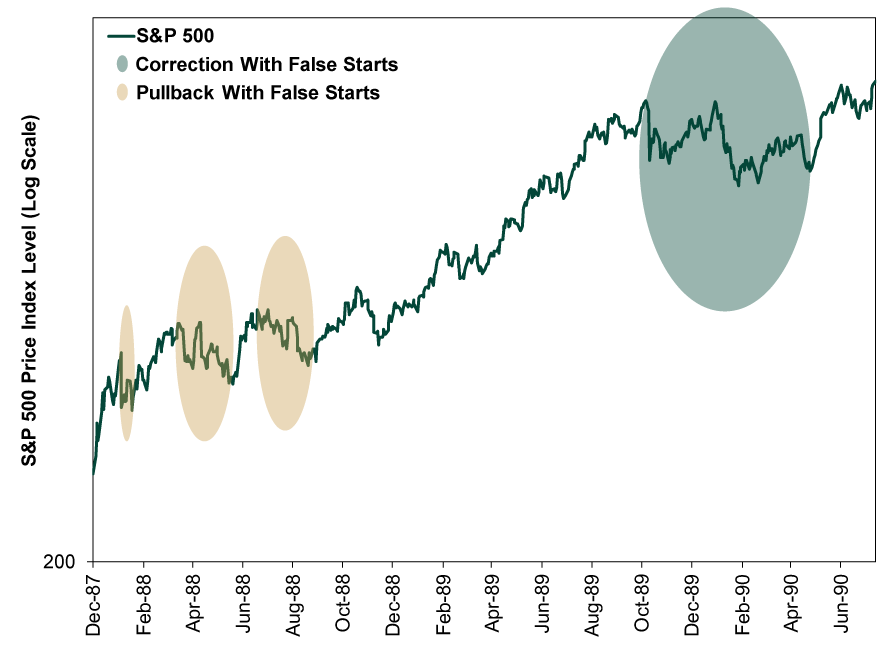
Source: FactSet, as of 2/27/2018. S&P 500 Price Index, 12/4/1987 – 7/16/1990. Correction defined as a drop of -10% or greater. Pullback defined as a drop of 6% or greater.
Exhibit 3: Double Dips in the 1990 – 2000 Bull

Source: FactSet, as of 2/27/2018. S&P 500 Price Index, 10/11/1990 – 3/24/2000. Correction defined as a drop of -10% or greater. Pullback defined as a drop of 6% or greater.
Exhibit 4: Double Dips in the 2002 – 2007 Bull
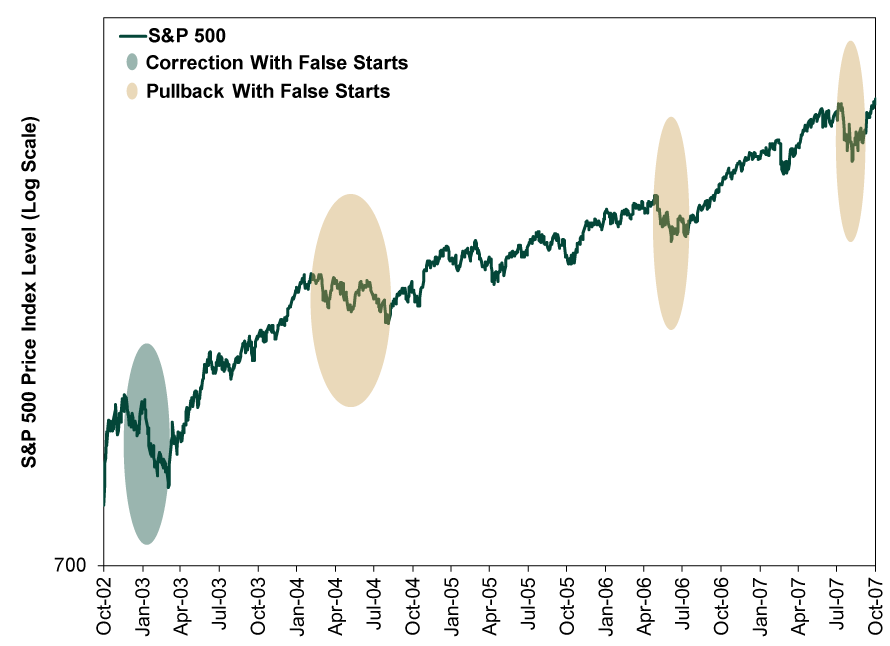
Source: FactSet, as of 2/27/2018. S&P 500 Price Index, 10/9/2002 – 10/9/2007. Correction defined as a drop of -10% or greater. Pullback defined as a drop of 6% or greater.
Exhibit 5: Double Dips in the Current Bull
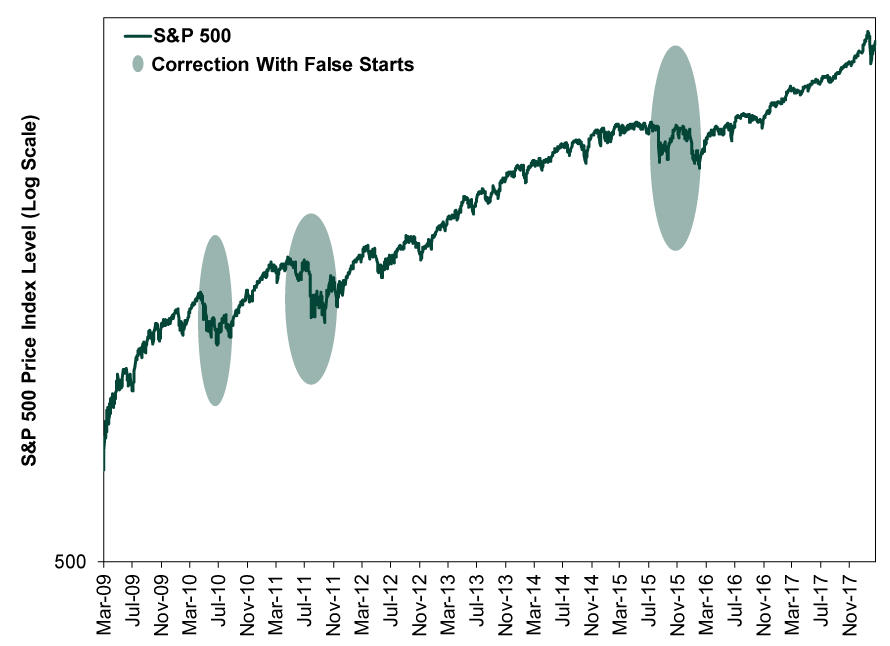
Source: FactSet, as of 2/27/2018. S&P 500 Price Index, 3/9/2009 – 2/26/2018. Correction defined as a drop of -10% or greater. Pullback defined as a drop of 6% or greater.
If you would like to contact the editors responsible for this article, please message MarketMinder directly.
*The content contained in this article represents only the opinions and viewpoints of the Fisher Investments editorial staff.
Get a weekly roundup of our market insights
Sign up for our weekly e-mail newsletter.

You Imagine Your Future. We Help You Get There.
Are you ready to start your journey to a better financial future?

Where Might the Market Go Next?
Confidently tackle the market’s ups and downs with independent research and analysis that tells you where we think stocks are headed—and why.
Related Resources
-
Market Analysis The New Tariffs in Town Are Still Old News2026-07-24
-
Expert Commentary This Week in Review | Market Volatility, Tariffs, SpaceX
 2026-07-24
 -
Economics A Summertime Check-in on US Consumers2026-07-23
-
Expert Commentary Why Ken Fisher Is Optimistic About European Stocks
 2026-07-23


Learn More
Learn why 210,000 clients trust us to manage their money and how Fisher Investments and its affiliates may be able to help you achieve your financial goals.
As of 6/30/2026
New to Fisher? Call Us.
Contact Us Today