Personal Wealth Management / Market Analysis
On the Split in January Jobs Data
And why we don’t think it is cause for investor concern.

Last Friday, the US Bureau of Labor Statistics (BLS) reported nonfarm payrolls rose by 467,000 in January, trouncing expectations—and diverging sharply from payroll processor ADP’s January jobs report’s -301,000 drop. That may seem confusing or even troubling considering the importance many place on jobs data. Some may wonder which jobs market assessment is a more accurate reflection of the US economy’s state—and how that may influence stocks. But a closer look at how each report tracks jobs reveals the conflicting results aren’t cause for alarm.
January’s was ADP’s first monthly job loss since December 2020, with employment in all industries negative except natural resources and mining. The leisure and hospitality industry had the most losses (-154,000), and small businesses (defined as 1 – 49 employees) fared worse than medium- and large-sized businesses. Sounds bad.
However, the BLS report painted a very different picture: Nonfarm payrolls beat consensus expectations of a 155,000 gain, which included projections as weak as -250,000 losses.[i] After last Friday’s release, some experts thought January’s figure could have been even higher if it wasn’t for Omicron. Notably, the BLS reported employment in leisure and hospitality rose by 151,000—a stark contrast to ADP’s conclusions.
While the two labor reports’ high-level findings appear to send conflicting signals, this isn’t an apples-to-apples comparison. For one, ADP and BLS measure different groups. ADP uses data from about 460,000 ADP private-sector clients, covering about 26 million workers.[ii] For its establishment survey, the BLS polls about 131,000 private businesses and government agencies—which represents about 670,000 individual worksites and reflects about one-third of all nonfarm payroll jobs (about 50 million workers as of January 2022).[iii] Both outfits employ different methodologies, too. ADP counts all active workers as employed regardless of whether they are paid or not during the survey period. Per the BLS’s criteria, employees must have worked or received pay for at least part of the survey period—otherwise, they count the worker as unemployed.
Given expectations of Omicron’s negative impact on jobs, it may seem odd ADP showed a loss while the BLS showed gains. Rampant absenteeism would seemingly have a bigger impact on the latter’s numbers, especially since employees unable to work and without sick pay would register as unemployed. But in our view, this highlights COVID’s unpredictable skew on economic data—something all data-gathering agencies (and especially the BLS) must contend with. Take seasonal adjustments. Labor data follow seasonal patterns—e.g., many businesses hire seasonal workers leading up to the winter holiday period and let them go at its conclusion. Traditionally, lots of layoffs happen in January as holiday-driven work ends. But due to Omicron, many businesses were already understaffed—so they likely let unusually few workers go, boosting the BLS’s January payrolls figure.
Moreover, the BLS just finished the annual update of its seasonal adjustment model, which the agency hopes will better account for seasonal patterns in the pandemic-impacted economic environment. After applying its revisions, the BLS found employers added 709,000 more jobs in November and December 2021 than previously estimated in that two-month period. However, this revision basically reverses earlier jobs data: The employment change in June and July 2021 combined was -807,000 lower than initially reported. We don’t think it is a coincidence these stretches aligned with periods of variant surges that may have impacted the BLS’s original jobs estimates. Even during normal times, monthly data are subject to short-term noise and skew. Today, a COVID-related asterisk accompanies just about every macroeconomic dataset.
On a month-to-month basis, the divergence between the two reports may seem big. But over the longer term, ADP’s and BLS’s counts of private payrolls have generally tracked each other. (Exhibit 1) Before the split beginning in 2020, the two datasets diverged directionally only five times over the past two decades—and all proved to be blips.
Exhibit 1: The ADP’s and BLS’s Private Payrolls Numbers Generally Track Each Other
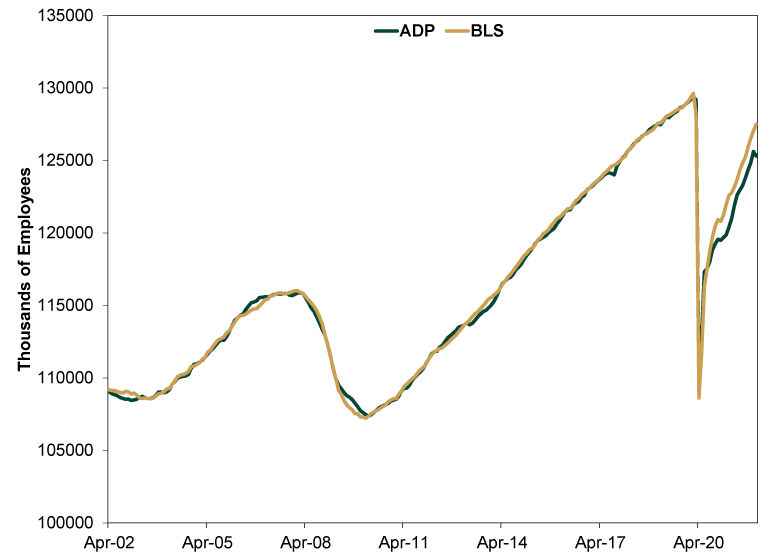
Source: St. Louis Federal Reserve and BLS, as of 2/9/2021. ADP’s total nonfarm private payroll employment and BLS’ employees on nonfarm private payrolls, April 2002 – January 2022.
Over the past two COVID-dominated years, ADP’s figures have been a bit lower than the BLS’s—and it is possible this divide continues and even deepens. But as both organizations’ economists update their data to more accurately account for the pandemic’s impact, it is also possible future revisions wipe away the current difference. Moreover, today’s split doesn’t negate the broader point: Both measures of private employment show sharp recovery after early-2020’s economic downturn. The latest divergence doesn’t automatically mean an inflection point is at hand, and none of this is predictive for stocks anyway.
On a month-to-month basis, different reports may seem to send conflicting messages—a big reason why we think it is important to weigh short-term moves against longer-term trends. That trend highlights the relevant takeaway for investors, in our view: Despite bumps and setbacks, employment in America’s private sector has rebounded in sympathy with the broader recovery. The latest jobs data merely confirm a reality stocks began moving on back in March 2020. These backward-looking, late-lagging metrics don’t tell you much about what lies ahead for stocks, but they can help you make sense of the not-so-distant past.
[i] “America’s Economic Recovery Is About to Go Into Reverse,” Anneken Tappe, CNN, 2/3/2022.
[ii] “MainStreet Macro: Where Do Jobs Numbers Come From?” Nela Richardson, ADP, 10/7/2021.
[iii] Ibid. and “Technical Notes for the Current Employment Statistics Survey,” BLS, 2/4/2022. Per the BLS, nonfarm payrolls was about 150 million people as of January 2022.
If you would like to contact the editors responsible for this article, please message MarketMinder directly.
*The content contained in this article represents only the opinions and viewpoints of the Fisher Investments editorial staff.
Get a weekly roundup of our market insights
Sign up for our weekly e-mail newsletter.

You Imagine Your Future. We Help You Get There.
Are you ready to start your journey to a better financial future?

Where Might the Market Go Next?
Confidently tackle the market’s ups and downs with independent research and analysis that tells you where we think stocks are headed—and why.
Related Resources
-
Market Analysis More Positive Surprise in Japan’s Q1 GDP2026-05-19
-
Market Analysis The Investment Implications of Record-Low Consumer Sentiment2026-05-19
-
Weekly Wrap-Up Fisher Investments Reviews: Last Week in Markets—May 11 - May 152026-05-18
-
Behavioral Finance Investing Lessons From the Indianapolis Motor Speedway2026-05-18


Learn More
Learn why 200,000 clients trust us to manage their money and how Fisher Investments and its affiliates may be able to help you achieve your financial goals.
As of 3/31/2026
New to Fisher? Call Us.
Contact Us Today