


Personal Wealth Management / Market Analysis
US Debt Remains Affordable
America’s debt load isn’t overwhelming.

A perennial false fear reared its head again as America’s debt odometer crossed the $40 trillion mark last week. Meanwhile, Treasury Secretary Scott Bessent announced the buyback program for long-term US Treasury bonds will double in size next month—sparking further alarm that the government is worried over debt affordability and warnings that the plan failed when yields kept ticking up. So are Treasurys—the bedrock of the global financial system—in trouble now? We think not, and a closer look at the evidence shows why.
While $40 trillion admittedly has a lot of zeros, round numbers are coincidences, not earthshattering revelations, tipping points or dark omens. Although $40 trillion makes headlines, it isn’t shocking. US debt and deficits are among the financial press’s most covered topics. They aren’t sneaking up on anyone, least of all markets.
The Congressional Budget Office (CBO)—the nation’s official financial scorekeeper—has penciled in $40 trillion for over a year.[i] So have countless other economic forecasting shops both public and private. It was always a matter of precisely when, not if. Yet this $40 trillion figure is also meaningless. A big chunk of it sits within the government—money Uncle Sam owes himself. The more relevant figure is net—publicly held—debt, which excludes this. That is currently $32 trillion. In February 2024, CBO projected America hitting this level in 2026.[ii] Here, too, no surprise.
Meanwhile, the Treasury announced it would “at least double” buybacks on issues 10 years and longer.[iii] To some, that suggests it fears high rates. But as many noted, the planned doubling to around $4 billion would be a drop in the bucket. Treasurys’ average daily trading volume last month was $1.2 trillion.[iv] Outstanding marketable long-term Treasury bonds total about $5.5 trillion.[v] Buying back $4 billion daily hardly dents supply. It is a rounding error.
Failing to scale is a classic error fearful headlines make when dealing with huge numbers. Here is another: Ignoring context. While bond buybacks are gaining more attention now, they aren’t new. It is right there in the announcement: This is an expansion of existing buybacks. Treasury routinely employs buybacks as part of its regular debt management operations and has done so for decades. For example, older securities often tend to trade less, so Treasury frequently (once or twice weekly) provides liquidity support allowing dealers and investors to sell these “off-the-run” issues at a predictable bid.
These buybacks help keep the Treasury market functioning smoothly across the entire maturity curve. Bear in mind, bonds aren’t like stocks. Most don’t trade on a centralized exchange with to-the-second pricing. They trade over the counter. Buybacks help address the liquidity issues inherent in this system.
But whether Treasurys outstanding are $40 trillion or buybacks are $4 billion is beside the point. What matters for investors: Can Treasury roll over its debts—issue new bonds to repay and replace maturing principal—and make interest payments on the existing stock without breaking the bank? We think so: Treasury debt auctions consistently see demand over twice supply. For example, last Wednesday’s 20-year Treasury auction was 2.53 times oversubscribed.[vi] The next day, 30-year Treasury Inflation Protected Securities (TIPS) saw bids 2.82 times the amount offered.[vii]
Treasury has no trouble issuing such debt because buyers know it can afford to make ongoing interest payments on the lot. As Exhibit 1 shows, 2025 federal receipts (green line) covered debt service payments more than five times over. Yes, America’s debt service ratio (DSR) is at the high end of the historical record, and as monthly readings (gold) from Treasury’s budget statements also show, 2026 payments likely eat up more.
Exhibit 1: Despite Record High Debt Service, Treasury Easily Covers Interest Outlays
Source: Federal Reserve Bank of St. Louis and FactSet, as of 8/20/2026.
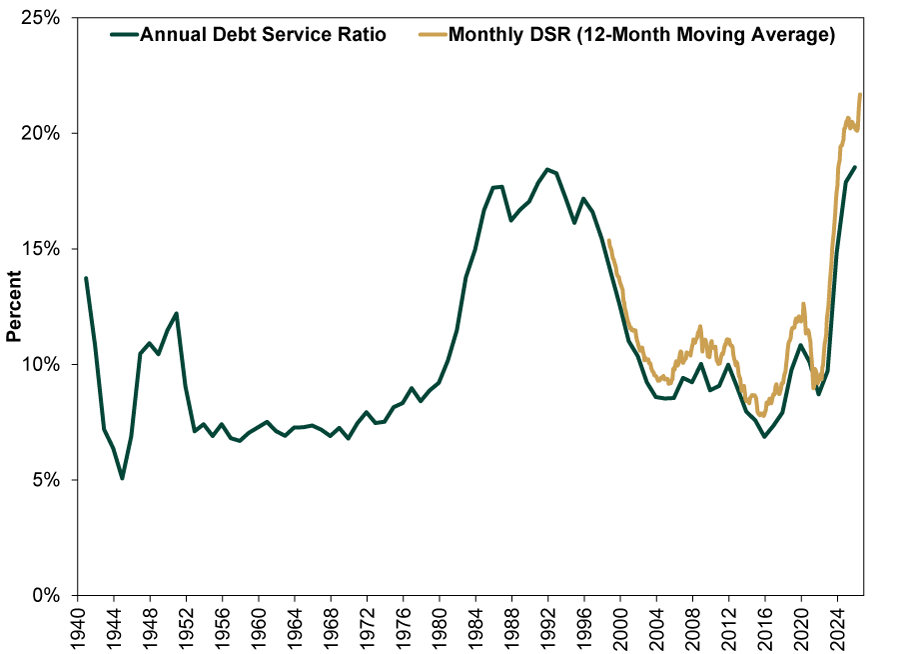
But that still leaves government’s internal revenue covering interest obligations by over four times—which may not be great, but it isn’t cause for crisis either. After all, the late-1980s and early-1990s experience of yearslong high debt service wasn’t bearish or bad economically. There were some genuine booms in that era.
Another way to put US—and global—debt in perspective: In 2020, the Institute of International Finance (IIF) estimated total global debt (government, corporate and household) increased a whopping $24 trillion to reach $281 trillion—about 326% of global GDP then, using the IMF’s figure.[viii] Many warned of unsustainable debt. But of course, a financial catastrophe never ensued. The IIF now estimates global debt outstanding at $353 trillion, while the IMF puts 2026 global GDP at $126 trillion, so roughly 280% of GDP.[ix] Theoretically, global debt could rise to around $411 trillion (3.26 times $126 trillion)—$58 trillion more than today—and still not trigger calamity. The world’s debt capacity is much greater than most realize.[x] (For those buying the narrative around AI-related issuance crowding out government borrowing, re-read that passage again.)
Then, too, with debt fears hitting overdrive, many overlook the positive signs emanating from the bond market. For one, yield curves—an issuer’s rates from short to long maturities—are steepening globally. Rising long rates often get cast as negative since no one likes paying higher borrowing costs. Central banks spent about 15 years since the 2008 financial crisis deliberately lowering long rates to boost loan demand! But headlines and central banks missed something big: Banks prefer higher long rates and lend more enthusiastically, which is where actual economic stimulus comes from. When banks’ lending rates rise more than funding costs (short rates), every new loan they make becomes more profitable, which motivates them to take more risk and lend to a wider swath of buyers.
In America and globally, steeper yield curves are helping incentivize faster loan growth. US bank lending, for instance, has accelerated from 5.8% y/y at 2026’s start to 7.3% in August so far.[xi] Loan supply is up, and businesses and households seem willing to pay for it. That should fuel future economic activity and growth. And with more growth comes more tax revenue for Uncle Sam to help service his debts.
[i] “The Budget and Economic Outlook: 2025 to 2035,” Staff, CBO, 1/17/2025.
[ii] “The Budget and Economic Outlook: 2024 to 2034,” Staff, CBO, 2/7/2024.
[iii] “Treasury Doubles Debt Buybacks as Bessent Moves to Steady Bond Market,” Jeff Cox, CNBC, 8/19/2026.
[iv] Source: Securities Industry and Financial Markets Association (SIFMA), as of 8/10/2026.
[v] Source: US Treasury, as of 8/24/2026.
[vi] Source: TreasuryDirect, as of 8/19/2026.
[vii] Source: TreasuryDirect, as of 8/20/2026.
[viii] Source: IMF, as of 8/24/2026. World GDP, current prices, 2020. “Global Debt Monitor: COVID Drives Debt Surge—Stabilization Ahead?” Staff, IIF, 2/17/2021.
[ix] Source: IMF, as of 8/24/2026. World GDP, current prices, 2026. “Global Debt Monitor: Record Debt, Resilient Markets—Justifiable Optimism?” Staff, IIF, 5/6/2026.
[x] Though we don’t think GDP is the best way to scale debt affordability—government or firm revenue makes more sense—for back-of-the-envelope calculations on global debt (public and private), global GDP is a good enough proxy for this thought exercise.
[xi] Source: Federal Reserve Bank of St. Louis, as of 8/24/2026.
If you would like to contact the editors responsible for this article, please message MarketMinder directly.
*The content contained in this article represents only the opinions and viewpoints of the Fisher Investments editorial staff.
Get a weekly roundup of our market insights
Sign up for our weekly e-mail newsletter.

You Imagine Your Future. We Help You Get There.
Are you ready to start your journey to a better financial future?

Where Might the Market Go Next?
Confidently tackle the market’s ups and downs with independent research and analysis that tells you where we think stocks are headed—and why.
Related Resources
-
Politics Context for the Noisy Congress to Come2026-10-09
-
Expert Commentary This Week in Review | S&P 500 Record High, Fed Minutes, Spain Election
 2026-10-09
 -
Interesting Market History Notes on a Bear Market Anniversary2026-10-09
-
Economics Checking in on US Consumers2026-10-08




Learn More
Learn why 210,000 clients trust us to manage their money and how Fisher Investments and its affiliates may be able to help you achieve your financial goals.
As of 9/30/2026
New to Fisher? Call Us.
Contact Us Today