Personal Wealth Management / Market Analysis
Why We Don’t Think Valuations Should Worry You
Near term or long term, valuations don’t predict stock returns.

With stocks flirting with bear market territory lately, negative analyses abound as fearful headlines tout reasons things will only get worse. One subject cropping up: valuations, which many claim are still too high. Some take a near-term, cyclical view, suggesting today’s valuations aren’t at trough levels. Others suggest current valuations point to historically low long-term returns ahead. But we think you can set such worries aside: History and data show valuations predict neither short-term nor long-term returns.
Valuations, especially price-to-earnings (P/E) ratios, are among the most watched market metrics out there. Hence, many have noticed the big drop in the S&P 500’s 12-month forward P/E, to use one example. (Though forward earnings are only estimates, analysts often prefer using them in P/Es’ denominator because investors typically own stocks for future, not past, profits.) From 23 at the year’s start, it has fallen to 16 now, a roughly 30% discount.[i] Cheaper! However, 16 is about average historically.[ii] Similarly, trailing 12-month P/Es, which compare current prices to the past 12 months’ earnings, are also around average. Even broader indexes like the MSCI World show something similar.
To hear many bargain hunters say it, average isn’t cheap—or at least, it isn’t cheap enough for the market slide’s bottom to be near. It especially isn’t cheap enough for Tech, a high-flyer up until this year. But as we showed last September, P/Es don’t predict turning points in markets—or returns over the next year. Using a statistical measure called R2, which tells you how much P/Es can explain the next 12 months’ returns—ranging from 0 (not at all) to 1 (fully)—the R2 is 0.01.[iii] Whatever valuation stocks are at—high, low or average—it is a coin flip what direction stocks will go from there. “Expensive” stocks can always become more expensive. “Cheap” stocks can always get cheaper.
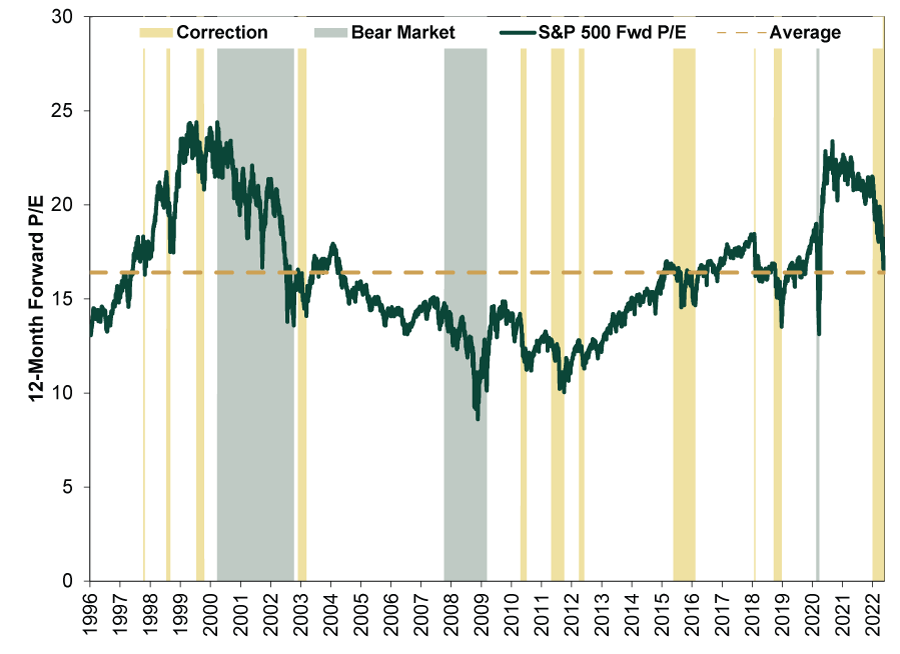
To see this another way, Exhibit 1 shows how forward P/Es bob and weave during corrections (sharp sentiment-fueled -10% to -20% pullbacks, yellow shading) and bear markets (fundamentally driven declines exceeding -20%, green shading). Yes, naturally, P/Es tend to overall drop through both, but there is no set point when corrections and bear markets begin or end.
Exhibit 1: Corrections End at High, Middle and Low P/Es
Source: FactSet, as of 5/25/2022. S&P 500 12-month forward P/E, 1/1/1996 – 5/24/2022.
Even trailing P/Es’ longer history doesn’t support the view they predict. Two of the last three bear markets ended at sky-high P/Es, as economic downturns obliterated earnings—and forward-looking stocks took off expecting better days to come. 2007 – 2009’s is a great example of that.
Some admit that P/Es can’t identify turning points. Instead, they say P/Es imply a long period of low returns ahead—maybe even a lost decade. But there isn’t any strong correlation between valuations and long-term returns, either. As best as we can find, the S&P 500’s trailing 12-month P/Es have only a slight correlation with its subsequent 20-year returns. At that timeframe, the R2 is 0.27—weak and statistically pretty insignificant.[iv] This all makes sense. Predicting far-future corporate profit margins and earnings growth is just guessing. Not only are long-term earnings forecasts irrelevant, try figuring out what investors will likely pay for those guesses. In our view, it is a futile endeavor.
We think valuations don’t tell investors anything useful about future returns because they are backward-looking (using trailing earnings) or largely known and priced in already (with forward earnings). P/Es and other ways to slice and dice companies’ metrics—and projected metrics—are among the most pored-over figures on Wall Street. As all the current attention attests, they are widely watched. But as Finance 101 also suggests, factors everyone pays attention to have limited predictive ability. To be useful, forecasts have to incorporate information others miss—or look at available data differently from the crowd. Otherwise, adaptive markets likely reflect the information already. It is a high bar, which headline valuation fears don’t meet, in our view.
[i] Source: FactSet, as of 5/25/2022. S&P 500 next-12-month P/E ratio, 12/31/2021 – 5/24/2022.
[ii] Ibid. Average S&P 500 next-12-month P/E ratio, September 1995 – April 2022.
[iii] Source: Global Financial Data, Inc., as of 5/25/2021. S&P 500 trailing 12-month P/E, monthly, and subsequent rolling 12-month price returns, December 1925 – April 2021.
[iv] Ibid. S&P 500 trailing 12-month P/E, monthly, and subsequent rolling 20-year annualized price returns, December 1925 – April 2002.
If you would like to contact the editors responsible for this article, please message MarketMinder directly.
*The content contained in this article represents only the opinions and viewpoints of the Fisher Investments editorial staff.
Get a weekly roundup of our market insights
Sign up for our weekly e-mail newsletter.

You Imagine Your Future. We Help You Get There.
Are you ready to start your journey to a better financial future?

Where Might the Market Go Next?
Confidently tackle the market’s ups and downs with independent research and analysis that tells you where we think stocks are headed—and why.
Related Resources
-
Market Analysis ‘Sell in May’ Looks to Be Going Astray. Again.2026-05-29
-
Market Analysis Big Gas Price Jump, Still a Small Spend2026-05-29
-
Expert Commentary This Week in Review | Consumer Confidence, Iran Developments, Bond Yields
 2026-05-29
 -
Market Analysis What AI Tech Stocks Are Signaling About This Bull
 2026-05-28


Learn More
Learn why 200,000 clients trust us to manage their money and how Fisher Investments and its affiliates may be able to help you achieve your financial goals.
As of 3/31/2026
New to Fisher? Call Us.
Contact Us Today