Personal Wealth Management / Market Analysis
Why We Don’t Think High Valuations Signal a Dim Future
Near term or long run, valuations just don’t tell you much about future returns.

Valuations are historically high, a fact more and more headlines seem to be touting as a negative allegedly frothy markets are overlooking. As the plausible-seeming explanation goes, valuation metrics like price-to-earnings (P/E) ratios show markets are at their most expensive since the dot-com bubble, supposedly foretelling poor returns. Sometimes folks claim this is about returns immediately ahead—and that a bear market may lurk around the corner. Other times it refers to the long-run future. But to us, this implies valuations are predictive. History shows you otherwise, a lesson worth taking note of now, in our view.
P/Es come in various flavors depending chiefly on the earnings denominator. Some use trailing 12-month earnings. Others include those hinging on analysts’ 12-month forward earnings estimates or the bizarrely distorted cyclically adjusted P/E (CAPE), which employs a 10-year average of inflation-adjusted earnings. But lately, it is the first—the trailing P/E—most fearful headlines seem to tout. According to data from Global Financial Data, Inc., the S&P 500’s trailing 12-month P/E is presently hovering around 35—in the top 3% of readings since 1926.[i] Sound alarming? It isn’t. Here is why.
For one, last year’s lockdown-skewed quarterly results are still influencing the calculation. The destruction of firms’ profits last year plus the steep rally in stocks—which anticipated better corporate results ahead tied to reopening—inflated P/Es massively. This also explains why the current level (35.3) is actually down from June’s peak (45.7)—Q2’s blockbuster earnings helped. But the current valuation still includes depressed earnings in Q3 and Q4. Against this backdrop, we don’t think it is abnormal for valuation ratios to seem elevated.
Another disconnect we see is in pundits’ purported relationship between valuations and subsequent returns. Newsflash: There is none. Take Exhibit 1, which maps trailing P/Es and their price return one year later.
Exhibit 1: 1-Year Stock Return Versus P/E Ratio, 1926 – 2020
Source: Global Financial Data, Inc., as of 9/7/2021. S&P 500 trailing 12-month P/E, monthly, and subsequent rolling 12-month price returns, December 1925 – August 2020.
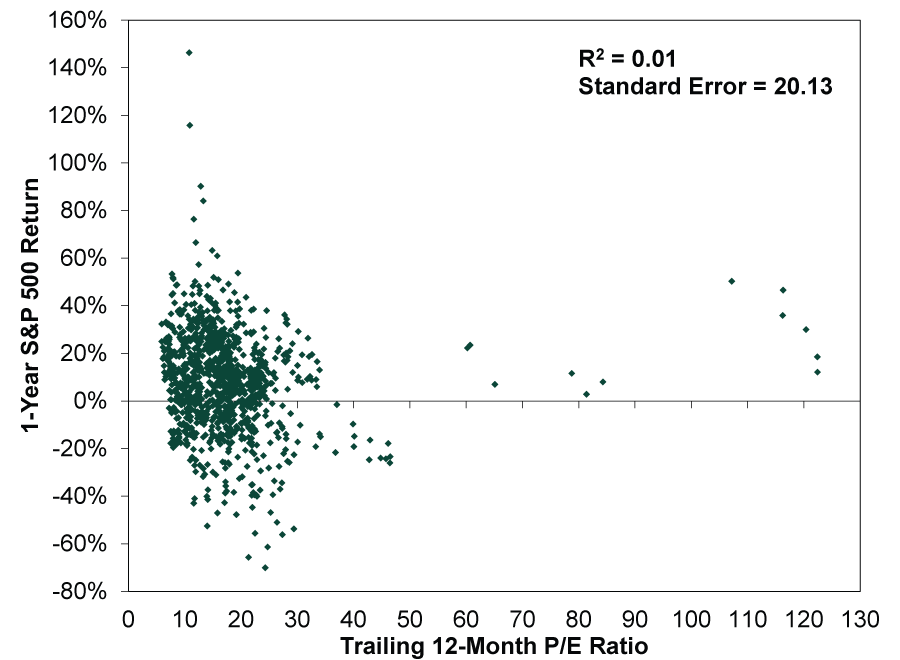
It looks scattershot because it is. There are relatively few months of 35 or higher, clustered into two time periods: One is the Tech bubble, and returns 12 months from those instances were bad. The other is the aftermath of 2008’s financial crisis where returns in the ensuing 12 months were strongly positive. Those offset. But even if we water this down to get more data points, you see little identifiable relationship. For example, at around 25 times trailing earnings—far higher than the index’s 16.4 historical median—there are about as many dots above 0% as below.[ii] A high (or low) P/E doesn’t tell you where stocks will go over the next year.
In statistics, a measure known as R2, which tells you how much the P/E ratio explains the next 12 months’ returns, captures this non-correlation. A near-zero reading, like in Exhibit 1, indicates valuations explain almost no aspect of forward market returns, while a reading of 1 would indicate valuations completely explain them. Standard error is a measure of the statistical accuracy of an estimate. In this case, there is a 68% likelihood stocks’ one-year return is within plus or minus 20.13 percentage points of the average return for any given P/E.[iii] That is a very wide range—scattershot.
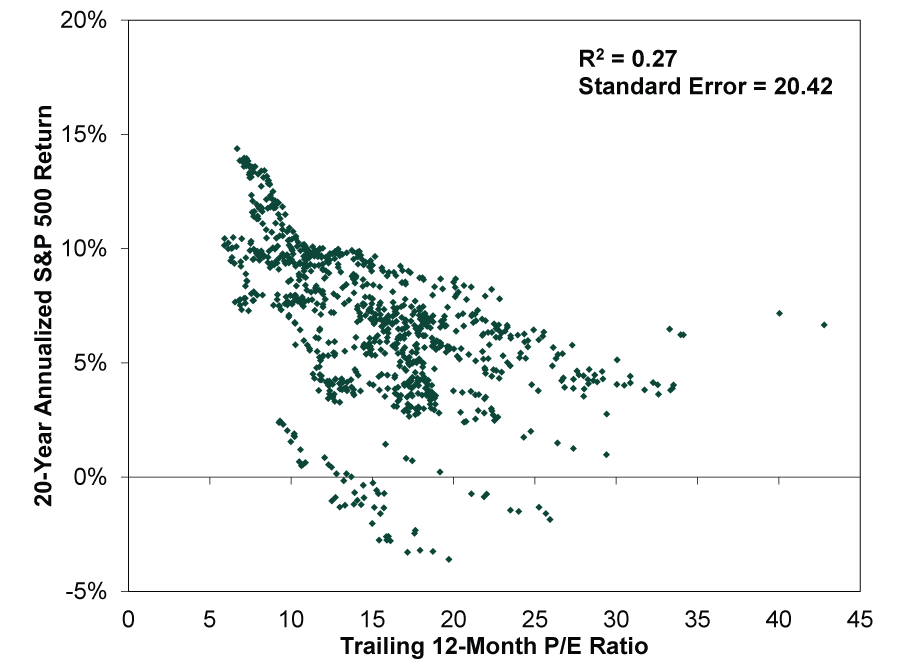
The same goes for the longer term. P/Es don’t foretell distant future returns either. Their ability to predict returns years away are about as scattershot. The best forecasting job P/Es have done is around a 20-year time horizon, where stocks’ future returns correlate with P/Es 27% of the time—an R2 of 0.27—a weak relationship. Statisticians generally require an R2 above 0.70 to have any explanatory power. Now, if you squint a little, Exhibit 2 shows lower trailing P/Es correspond slightly with higher annualized returns. Thing is, high P/Es can still deliver very good 20-year appreciation. Note, too: Over 30-year time horizons, returns are all positive.[iv]
Exhibit 2: 20-Year Annualized Stock Return Versus P/E Ratio, 1926 – 2001
Source: Global Financial Data, Inc., as of 9/7/2021. S&P 500 trailing 12-month P/E, monthly, and subsequent rolling 20-year annualized price returns, December 1925 – August 2001.
Why doesn’t valuation drive stocks? Because most valuation measures—trailing P/Es, CAPE, price-to-sales ratios, dividend yields, market capitalization to GDP, etc.—are backward looking. Even forward P/Es, comparing analysts’ earnings projections to prices, are based on estimates made at a given point in time. They often prove too low, inflating P/Es. Moreover, all are widely known, as valuations are among the most commonly taught investment analytics tools. Too many people watch them.
What moves forward-looking stocks most, in our view, is the gap between reality and expectations. At best, valuations give a sense of sentiment—a coincident indicator of what investors are willing to pay for expected future earnings. Now, if you had spiking valuations the public either was ignoring or explaining away, that could be a troubling sign. But we have the opposite now, and that suggests to us more bull market lies ahead.
[i] Source: Global Financial Data, Inc., as of 9/7/2021. S&P 500 trailing 12-month P/E, monthly, December 1925 – August 2021.
[ii] Ibid. Median S&P 500 trailing 12-month P/E, monthly, December 1925 – August 2021.
[iii] “Standard Error,” Staff, ChangingMinds.org, retrieved on 9/7/2021.
[iv] Source: Global Financial Data, Inc., as of 9/7/2021. S&P 500 trailing 12-month P/E, monthly, and subsequent rolling 30-year annualized price returns, December 1925 – August 1991.
If you would like to contact the editors responsible for this article, please message MarketMinder directly.
*The content contained in this article represents only the opinions and viewpoints of the Fisher Investments editorial staff.
Get a weekly roundup of our market insights
Sign up for our weekly e-mail newsletter.

You Imagine Your Future. We Help You Get There.
Are you ready to start your journey to a better financial future?

Where Might the Market Go Next?
Confidently tackle the market’s ups and downs with independent research and analysis that tells you where we think stocks are headed—and why.
Related Resources
-
Market Analysis On the June Inflation Cooldown2026-07-14
-
Expert Commentary 3 Things You Need to Know This Week | US Inflation, China GDP, US Retail Sales
 2026-07-13
 -
Weekly Wrap-Up Fisher Investments Reviews: Last Week in Markets—July 6 - July 102026-07-13
-
Expert Commentary This Week in Review | Global PMIs, SpaceX, RMD Planning
 2026-07-10


Learn More
Learn why 210,000 clients trust us to manage their money and how Fisher Investments and its affiliates may be able to help you achieve your financial goals.
As of 6/30/2026
New to Fisher? Call Us.
Contact Us Today