Personal Wealth Management / Market Analysis
A Closer Look at Rate Hike Cycles and Stocks
Stock returns are usually up solidly during them.

After the Fed’s first step up from zero last week, its dot plot of Federal Open Market Committee (FOMC) members’ fed-funds target rate projections implied more rate hikes at every meeting this year. If so, this would mean six more quarter-point increases, potentially putting the benchmark rate’s range at 1.75 – 2% by yearend. Fed-funds futures also reflect this, suggesting it is widely expected—and likely baked in to prices, to a large degree. There is a lot of chatter about what the Fed’s running the table would do to the stock market, but stocks are often resilient as rate hike cycles get going.
Historically, stocks have done better than you might think through rate hike cycles. As Exhibit 1 shows, cumulative S&P 500 returns were positive in 8 of the last 9, with an average annualized total return of 11.8% and a median of 7.5%. Past performance isn’t predictive, of course. But as a guide, history suggests stocks can hold up for sizable chunks of Fed “tightening” stretches.
Exhibit 1: Stocks Mostly Rise During Rate Hike Cycles
Source: Federal Reserve Bank of St. Louis, Global Financial Data, Inc., and FactSet, as of 3/21/2022. Federal-funds rate target, July 1971 – December 2008, federal-funds rate target upper limit, December 2008 – February 2022, and S&P 500 total returns, July 1971 – December 2018. Note: The Fed hiked in December 1986, but the cycle was brief. The S&P 500’s forward 12-month total return was 5.2%. *Percentage Point.
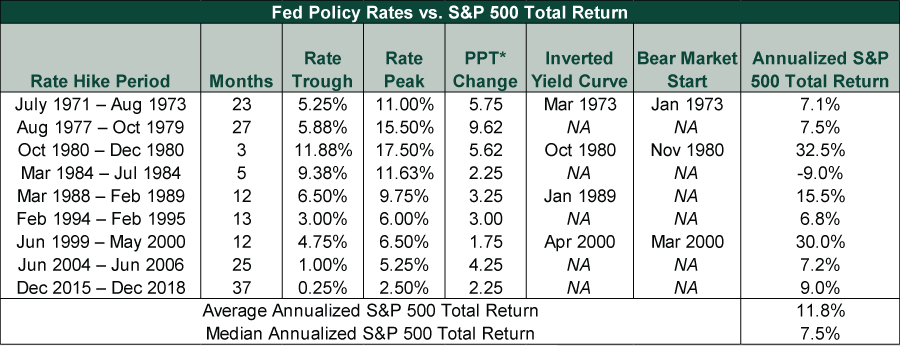
Now, as the table shows, some bear markets (typically prolonged, fundamentally driven declines exceeding -20%) began during these rate hike periods: in January 1973, November 1980 and March 2000. But all occurred amid Fed rate hikes that caused yield curve inversions, when short-term policy rates topped 10-year Treasury yields. On most occasions, the bear market didn’t begin for several months or more after the initial hike. In other words, we wouldn’t consider rate hikes by themselves as problematic for markets. Their impact on the yield curve is the swing factor, in our view.
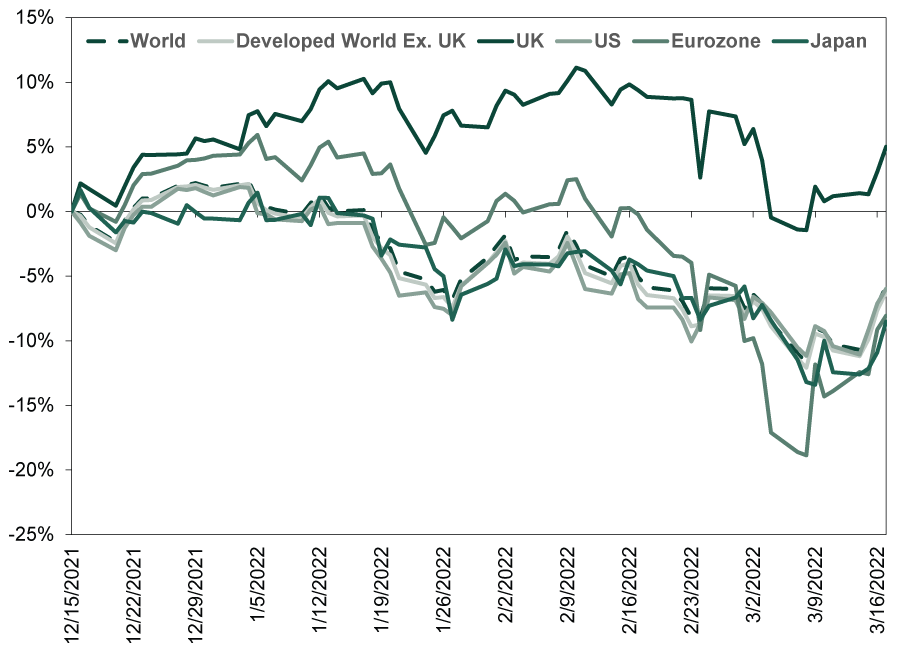
While this rate hike cycle is young, we have some preliminary evidence that successive rate hikes aren’t bad for stocks. The Bank of England (BoE) hiked its Bank Rate for the third straight time last Thursday. It is now back to pre-COVID levels. How have UK stocks fared during the BoE’s “tightening” so far? Since December 16, when the bank first hiked from 0.1% to 0.25%, to March 17’s move to 0.75%, the MSCI UK Index is up 5.0%.[i] (Exhibit 2) That is admittedly rather unremarkable, but it isn’t down, and relative to the rest of the world—which mostly hasn’t started hiking yet—the UK has handily outperformed. The MSCI World Index fell -5.8% over the same stretch. To us, this is evidence that even a pretty aggressive start to tightening isn’t automatically bearish.
Exhibit 2: BoE Rate Hikes Haven’t Stymied UK Markets
Source: FactSet, as of 3/21/2022. MSCI World, World excluding UK, UK, EMU and Japan returns with net dividends and S&P 500 total returns, 12/15/2021 – 3/17/2022.
More generally, we wouldn’t take the Fed’s dot plot as gospel (nor any other central bank projections). It is possible the fed-funds range’s upper bound hits 2% by yearend—and 2.75% in 2023 (as the dot plot and fed-funds futures also imply currently). Additionally, accompanying the “tightening” that suggests, there has been an uptick in concern that if the Fed follows this path, it could err and invert the yield curve since 10-year Treasury rates are currently 2.4%.[ii] A deep and prolonged inversion could indeed tighten financial conditions enough to cause recession, especially if global yield curves follow suit. Although we think this is something to watch out for, we think it is far too premature to worry about it now.
First, Fed decisions aren’t predictable. As we have written on numerous occasions, the interest rate forecasts in the FOMC’s dot plots aren’t anything to go by. They are Fed people’s opinion of where interest rates are likely to be if economic data evolve as they expect—not policy commitments or blueprints. Reality often defies dot-plot forecasts.
Second, the Fed’s power is overrated. A series of quarter-point rate hikes (or cuts) in aggregate may affect borrowing, depending on what long rates do, but we think the Fed is more of a rate follower than a rate setter. The Fed normally moves after the fact to where short-term Treasury rates already are—a straggler, not a trailblazer. If financial conditions are tightening, market-set rates will likely show it before the Fed confirms it.
Third, for markets, Fed decisions don’t have any preset outcomes. Rate hikes aren’t inherently bearish, and cuts aren’t necessarily bullish, either. (Or vice versa.) This is because markets pre-price expected Fed moves. If the Fed does what everyone already thinks is likely, there isn’t much reason to believe any action should drive stocks further beyond random short-term sentiment swings.
As for the yield curve, 10-year Treasury yields aren’t static. Just in the week since last Wednesday, they have climbed from 2.2% to 2.4%.[iii] Never read too much into short-term moves, but further Fed hikes causing an inversion in the near term isn’t a given. In the meantime, when waiting for future Fed actions, take solace: History and the present wall of worry—which includes “tightening” chatter—point to more bull market ahead.
If you would like to contact the editors responsible for this article, please message MarketMinder directly.
*The content contained in this article represents only the opinions and viewpoints of the Fisher Investments editorial staff.
Get a weekly roundup of our market insights
Sign up for our weekly e-mail newsletter.

You Imagine Your Future. We Help You Get There.
Are you ready to start your journey to a better financial future?

Where Might the Market Go Next?
Confidently tackle the market’s ups and downs with independent research and analysis that tells you where we think stocks are headed—and why.
Related Resources
-
Politics Blunting Burnham?2026-07-21
-
Market Analysis Why the SOX “Bear Market” Isn’t Foreboding2026-07-21
-
Expert Commentary 3 Things You Need to Know This Week | Q2 Earnings, ECB Meeting, Trump Accounts
 2026-07-20
 -
Weekly Wrap-Up Fisher Investments Reviews: Last Week in Markets—July 13 - July 172026-07-20


Learn More
Learn why 210,000 clients trust us to manage their money and how Fisher Investments and its affiliates may be able to help you achieve your financial goals.
As of 6/30/2026
New to Fisher? Call Us.
Contact Us Today