Personal Wealth Management / Market Analysis
Europe’s Recent Data Divide
No one economic indicator is all-telling.

A curious trend has emerged in European economic data in recent weeks—one we think is worth watching. While so-called soft data (e.g., survey-based indicators, chief among them purchasing managers’ indexes, or PMIs) have stayed strong across the board, some hard data (e.g., output measures like retail sales and industrial production) have struggled. French industrial production and German retail sales defied PMIs with contractions in recent days, missing consensus expectations in the process. German industrial production, released overnight, did grow 0.7% m/m in April, but that figure missed expectations—and follows a worse-than-expected -3.7% decline in March.[i] Now, we don’t think this is predictive for eurozone stocks, as markets are forward-looking. But we do think the data perhaps shed light on what eurozone stocks have priced in already, and they illustrate the follies of relying too much on any one indicator.
Exhibits 1 – 4 show the past few months’ worth of hard and soft data for the eurozone’s four largest economies (Germany, France, Spain and Italy). We limited our look to this short window for a simple reason: Pundits globally warn the war in Ukraine is a huge risk for Continental Europe’s economy, and that conflict started in late February. One looking only at PMIs would presume all four have sailed through with flying colors. But harder data show some struggles.
Exhibit 1: Germany
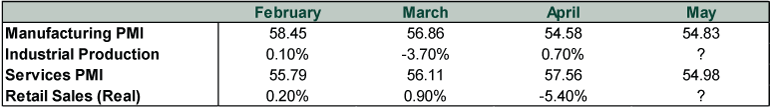
Source: FactSet, as of 6/8/2022. All figures are seasonally adjusted and, where noted and applicable, inflation adjusted. Question marks denote data that aren’t yet released. PMI readings over 50 indicate expansion.
Exhibit 2: France
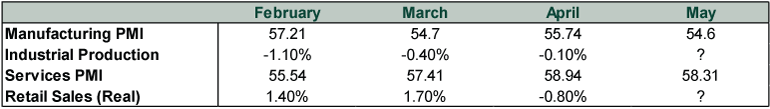
Source: FactSet, as of 6/8/2022. All figures are seasonally adjusted and, where noted and applicable, inflation adjusted. Question marks denote data that aren’t yet released. PMI readings over 50 indicate expansion.
Exhibit 3: Spain
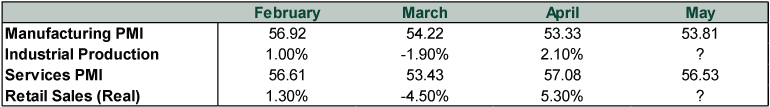
Source: FactSet and Eurostat, as of 6/8/2022. All figures are seasonally adjusted and, where noted and applicable, inflation adjusted. Question marks denote data that aren’t yet released. PMI readings over 50 indicate expansion.
Exhibit 4: Italy
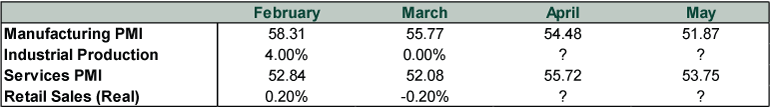
Source: FactSet and Eurostat, as of 6/8/2022. All figures are seasonally adjusted and, where noted and applicable, inflation adjusted. Question marks denote data that aren’t yet released. PMI readings over 50 indicate expansion.
Eurozone recession warnings have gotten louder as more negative results have hit the wire, and they very well could prove correct. Eurozone stocks, which fell as much as -24.8% from their prior high during this year’s downturn, have behaved much as we would expect if a regional recession were underway.[ii] Stocks generally move ahead of economic turning points, and the eurozone’s decline began back in September. Then again, the strong dollar plays a big role here, as it detracts from US investors’ returns on investments abroad (Americans get the stocks’ core return minus the home currency’s depreciation). In euros, eurozone stocks were down a much milder -15.1% over this stretch—a big, long correction (usually sentiment-fueled and between -10% and -20%), not a bear market (usually worse than -20%, longer-lasting and with a fundamental cause).[iii] Yet Germany has hit bear market territory in euros and France came a whisker away, so we suspect one may argue Continental stocks spent this winter and spring pricing in a recession.
Whether or not that comes true remains to be seen, however. For one, hard data come out at a lag. We are just now getting April figures, and as the tables showed, some of those registered improvement. The earlier negativity all falls under Q1, and we already have Q1 GDP results. Those showed Germany growing 0.9% annualized thanks to strong business investment and France contracting -0.8%, with household consumption leading the way down.[iv] Which brings us to the second caveat about all these monthly data: They are limited. Eagle-eyed readers will have seen French retail sales looking robust in Exhibit 2, which one would think points to strong household consumption. Yet retail sales exclude most services, and services happen to represent the majority of consumer spending. So that is a big blind spot.
Similarly, official data show German factory orders declining month-over-month in February, March and April, with May’s figures to be released. This might point to weak business investment, but that larger category also includes commercial real estate and intellectual property products (e.g., software and research and development). Then too, PMIs confirm some weakness in orders, as the manufacturing survey’s new orders subindex contracted in April and May, with many respondents noting slack demand from China—tied to now-ending lockdowns—as a driver. And, while it doesn’t break the countries down, the German Federal Statistics Office noted April’s decline in factory orders was “mainly due to orders abroad.”
In short, all monthly data have blind spots. We like PMIs because they are timely and have broad geographical reach within a country. But we also recognize their limitations: They reveal the percentage of businesses reporting increased activity overall, but they don’t report how much businesses overall grew (or shrank). Hard data, meanwhile, measure magnitude but only in specific categories that don’t always represent the whole.[v]
Therefore, we think it is best to consider all available data, hard and soft, and determine what the totality says. In Europe’s case, we think it presents an overall muddy picture. There are probably pockets of strength in categories that benefit from the easing of COVID restrictions and the areas where supply shortages are less of a factor (e.g., manufacturing excluding autos). Defense-oriented manufacturing may also be contributing positively. It also may be that a majority of businesses are pulling through fine, but the minority that have hit tough sledding are contracting enough to offset the others and pull the total down. Either way, it points to a mixed bag—economies that aren’t firing on all cylinders but perhaps also aren’t in the dire straits so many presume.
For investors, we think times like this make it crucial to remember how markets work. Whatever economic data and fears headlines dwell on, they aren’t sneaking up on stocks. If anything, eurozone stocks started pricing in a weakening economy well before anyone started trying to crunch numbers on the war’s impact. Stocks look forward, discounting the next 3 – 30 months or so. It may very well turn out that eurozone stocks’ upturn over the past month is their way of pricing in a future economic recovery. Or it could be a signal things are going less bad than feared, with the rest of the world pulling Europe along. Or—granted—it could be a false positive en route to a retesting of the low, but there is just no way to know this in advance. Sentiment-fueled swings are maddening like that.
At any rate, given what eurozone stocks have already endured this year, we don’t think it is fruitful for investors to continue getting hung up on weak economic data if they keep rolling in. Stock prices today likely already reflect whatever economic data show happened in April and May—they have lived through it and registered it in real time. Hard as it may be in the heat of the moment, looking forward and avoiding the temptation for knee-jerk reactions is probably the right move.
[i] Source: FactSet, as of 6/8/2022.
[ii] Source: FactSet, as of 6/8/2022. MSCI EMU Index return with net dividends in USD, 9/6/2021 – 5/9/2022.
[iii] Ibid. MSCI EMU Index return with net dividends in EUR, 9/6/2021 – 5/9/2022.
[iv] Source: FactSet, as of 6/8/2022.
[v] The one outlier here, which we will look more at next week when monthly GDP comes out, is the UK. The Office for National Statistics releases monthly output indexes for heavy industry and services, with a gauntlet of sub-indexes within them. Accordingly, it is often easier to divine GDP from UK monthly data, but given these indexes come out alongside monthly GDP, you don’t really get an edge here.
If you would like to contact the editors responsible for this article, please message MarketMinder directly.
*The content contained in this article represents only the opinions and viewpoints of the Fisher Investments editorial staff.
Get a weekly roundup of our market insights
Sign up for our weekly e-mail newsletter.

You Imagine Your Future. We Help You Get There.
Are you ready to start your journey to a better financial future?

Where Might the Market Go Next?
Confidently tackle the market’s ups and downs with independent research and analysis that tells you where we think stocks are headed—and why.
Related Resources
-
Market Analysis Why the SOX “Bear Market” Isn’t Foreboding2026-07-21
-
Politics Blunting Burnham?2026-07-21
-
Expert Commentary 3 Things You Need to Know This Week | Q2 Earnings, ECB Meeting, Trump Accounts
 2026-07-20
 -
Weekly Wrap-Up Fisher Investments Reviews: Last Week in Markets—July 13 - July 172026-07-20


Learn More
Learn why 210,000 clients trust us to manage their money and how Fisher Investments and its affiliates may be able to help you achieve your financial goals.
As of 6/30/2026
New to Fisher? Call Us.
Contact Us Today