Personal Wealth Management / Interesting Market History
Inflation Is Up, Gold Hasn’t Glittered
Gold’s alleged inflation-hedging prowess is substandard.

A long-held investment tenet claims gold is a great hedge against inflation. But before you nod along, consider: Despite the US consumer price index (CPI) ticking up 5.4% y/y—a rate last seen just over a decade ago—gold is down -5.4% on the year.[i] In our view, this is a clue to a broader truth: History shows gold’s inflation-hedging reputation rings hollow.
Exhibit 1 illustrates this year’s sharp divergence. Despite CPI’s accelerating from 1.3% y/y in December, gold has floundered.
Exhibit 1: No Hedge Year to Date
Source: FactSet and Federal Reserve Bank of St. Louis, as of 10/27/2021. Gold price per ounce, 12/31/2020 – 10/26/2021, and CPI, December 2021 – September 2021.
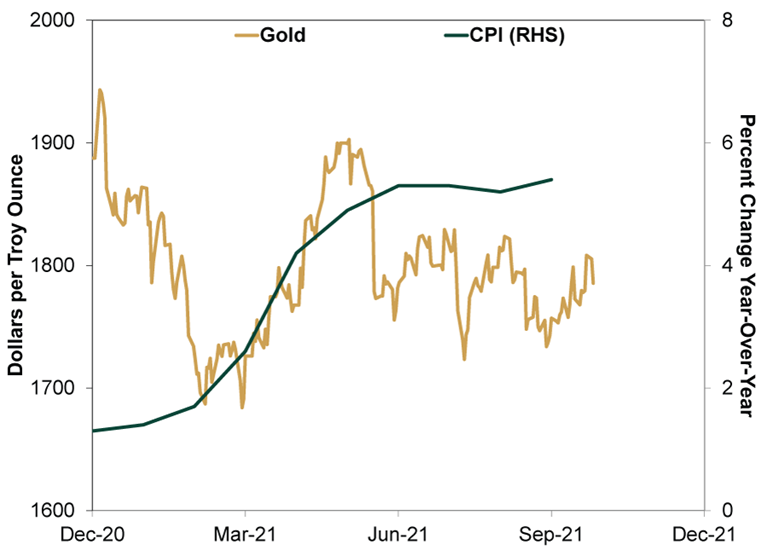
Now, gold’s spring run did coincide with the inflation rate’s doubling from March to June, but even then, it barely broke even for the year. Plus, while CPI inflation stayed elevated, gold fell back—not what you would expect from a true inflation hedge. It is also down -13.6% from August 6, 2020’s record high $2067, when CPI inflation was a paltry 1.0% y/y.[ii]
Obviously, this is one time period. Perhaps gold simply sees, as we do, that heightened inflation rates are likely to subside before long. But here is the thing: Even in other inflationary periods, gold’s performance has been spotty at best—an unreliable hedge. It performed well post-gold standard until September 1980 as CPI soared. But was this about inflation or the removal of fixed, government-set prices and ownership restrictions? With no counterfactual, you can’t know.
In any event, since then, it hasn’t always worked out so well. From December 1986 to October 1990, CPI accelerated from 1.2% y/y to 6.4%. Gold? It fell -2.9%.[iii] (Exhibit 2) Again like this year, there were short periods where gold seemed to hedge well. Through November 1987, CPI hit 4.5% y/y, while gold rose from $391 per ounce to $500 on December 14, 1987. For context, this was a week after the S&P 500’s bear market trough following October 19, 1987’s Black Monday crash. The rush into gold may have been inflation hedging then, but a good chunk of it could have been fear-based, sentiment-driven buying as well. Over the next few years though, CPI accelerated further, topping 5% in 1989 and then 6% in 1990. But from its December 1987 peak, gold fell -24.1% through Halloween 1990.[iv] During CPI’s run higher, gold worked as an inflation hedge for only about a third of the time—fleeting.
Exhibit 2: Not Really One Much Historically, Either
Source: FactSet and Federal Reserve Bank of St. Louis, as of 10/26/2021. Gold price per ounce, 12/31/1986 – 10/31/1990, and CPI, December 1986 – October 1990.

Or take March 1998 to March 2000, when CPI accelerated from 1.4% y/y to 3.8%. Gold dropped -8.1%.[v] Gold spiked from $255 an ounce on September 20, 1999 to $326 on October 5, 1999, which came as CPI rose above 2% y/y, but we think it is a stretch to believe this was the cause. Most commentary at the time attributed the two-week move to European central banks’ decisions to limit their gold sales and lending practices.[vi] As CPI accelerated every month from October 1999 to March 2000, gold fell -15.0%.[vii] Over a two-year period of rising inflation there was, at best, a two-week window where gold “worked” as an inflation hedge.
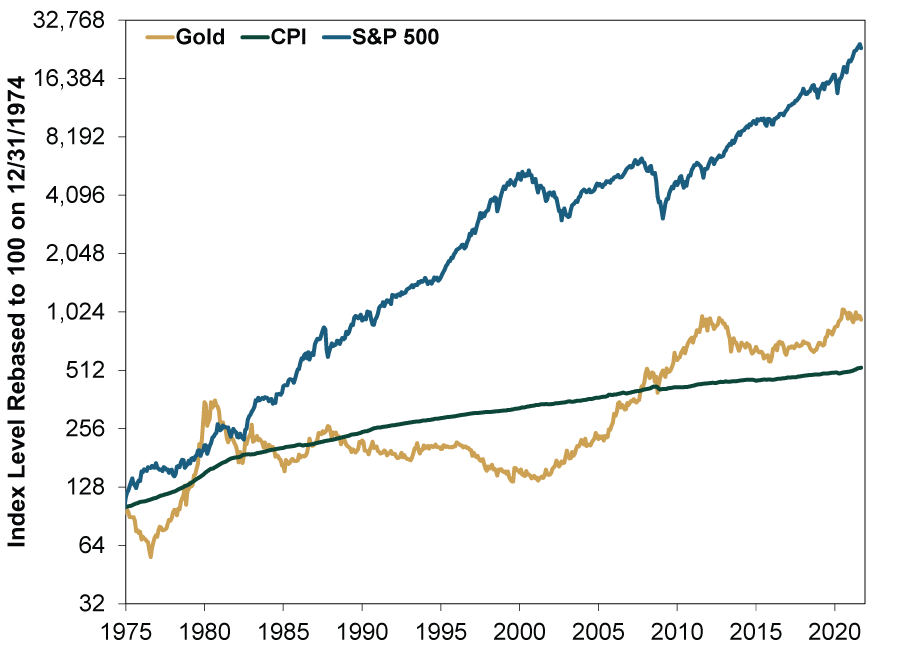
Over the long term, gold has outpaced CPI. (Exhibit 3) We will give it that much. Since December 1974—when prohibitions on gold ownership ended—CPI inflation averaged 3.6% annualized versus gold’s 4.9%.[viii] But as Exhibit 3 also shows, there are decades-long droughts when it was in long-term decline, like from 1980 to 2000. This highlights how doing well in gold requires remarkable timing, and inflation rates won’t help with that. While proponents tout gold’s limited supply as giving it mystical power to avoid debasement—unlike fiat currency—demand for it tends to fluctuate with investor sentiment. As we have seen, attitudes toward inflation—and their effect on gold—are hardly consistent, making gold’s moves impossible to time. Not great if you are looking to use it as an inflation hedge. Meanwhile, if you are looking at long time frames, stocks are far better at outpacing inflation, up 12.4% annualized since 1974’s end—with more frequent gains and lower volatility than gold.[ix]
Exhibit 3: Stocks a Better Inflation Hedge
Source: FactSet and Federal Reserve Bank of St. Louis, as of 10/27/2021. Gold price per ounce, CPI and S&P 500 total return, December 1974 – September 2021.
We don’t think inflation is likely to prove lasting today, as the currently elevated rates seem like a function of supply and demand mismatches driven by economic lockdowns and subsequent reopenings. As these even out, CPI rates should revert to the slow pre-pandemic norm. But even if inflation was likely to stay high, the case for gold is weak. It may make a good crown,[x] but as an investment—or an investment tool—it doesn’t have much utility today, in our view.
[i] Source: FactSet and Federal Reserve Bank of St. Louis, as of 10/27/2021. Gold price per ounce, 12/31/2020 – 10/26/2021, and CPI, September 2021.
[ii] Ibid. Gold price per ounce, 8/6/2020, and CPI, July 2020.
[iii] Ibid. Gold price per ounce, 12/31/1986 – 10/31/1990, and CPI, December 1986 – October 1990.
[iv] Source: FactSet, as of 10/27/2021. Gold price per ounce, 12/14/1987 – 10/31/1990.
[v] Source: FactSet and Federal Reserve Bank of St. Louis, as of 10/26/2021. Gold price per ounce, 3/31/1998 – 3/31/2000, and CPI, March 1998 – March 2000.
[vi] “Gold Tops $300 an Ounce,” Staff, CNN, 9/28/1999.
[vii] Source: FactSet, as of 10/27/2021. Gold price per ounce, 10/5/1999 – 3/31/2000.
[viii] Source: FactSet and Federal Reserve Bank of St. Louis, as of 10/27/2021. Gold price per ounce, 12/31/1974 – 9/30/2021, and CPI, December 1974 – September 2021.
[ix] Source: FactSet, as of 10/27/2021. S&P 500 total return, 12/31/1974 – 9/30/2021.
[x] Dental or otherwise.
If you would like to contact the editors responsible for this article, please message MarketMinder directly.
*The content contained in this article represents only the opinions and viewpoints of the Fisher Investments editorial staff.
Get a weekly roundup of our market insights
Sign up for our weekly e-mail newsletter.

You Imagine Your Future. We Help You Get There.
Are you ready to start your journey to a better financial future?

Where Might the Market Go Next?
Confidently tackle the market’s ups and downs with independent research and analysis that tells you where we think stocks are headed—and why.
Related Resources
-
Market Analysis Why the SOX “Bear Market” Isn’t Foreboding2026-07-21
-
Politics Blunting Burnham?2026-07-21
-
Expert Commentary 3 Things You Need to Know This Week | Q2 Earnings, ECB Meeting, Trump Accounts
 2026-07-20
 -
Weekly Wrap-Up Fisher Investments Reviews: Last Week in Markets—July 13 - July 172026-07-20


Learn More
Learn why 210,000 clients trust us to manage their money and how Fisher Investments and its affiliates may be able to help you achieve your financial goals.
As of 6/30/2026
New to Fisher? Call Us.
Contact Us Today