Personal Wealth Management / Market Analysis
Tall Tales Your Broker Told You
This bull market holds some valuable lessons for investors who base investment decisions on P/Es or dividends alone.

It's a longstanding tradition in the press and investment sales to hawk stocks with a great story-a compelling tale of the future prospects of this business for you to share in. Companies intuitively called "story stocks." Sometimes those story stocks pan out-the tale is nonfiction. But others, not so much. On a daily basis, we consume oodles of articles from news sources the world over, and we are here to tell you the press does the same thing with market-wide fears. They conjure a narrative, and that narrative exists whether facts support it ... or not. Here are two examples: Low P/Es[i] are the bees' knees and high-dividend stocks rock. Both have existed throughout the bull (sometimes simultaneously), despite being debunked again by the very same bull.[ii] In our view, this is a classic reminder that a good story-no matter how compelling-isn't a valid investment tactic or thesis absent supporting data.
First, let's tackle price-to-earnings ratios. The classic P/E narrative says low P/Es are a buy signal. A low price relative to earnings means you are paying a little for your share of a firm's profits (or expected profits). This seems to make sense, in that stock ownership is fundamentally about sharing in a company's earnings. So paying fewer dollars for more earnings seems wise and beneficial. Cheap stocks! Big performance ahead! On the flipside, high P/Es, the tale goes, mean investors are too optimistic about a company's prospects for the future-a warning sign prices will soon collapse. This is basically day one theory taught to newbies when learning about stocks, and it's also wrong. All it takes is a quick look at P/Es during this bull market to see they aren't predictive.
The S&P 500 Energy sector's P/E was below the S&P 500's for most of the period 2011 through 2014, implying undervalued Energy shares were ready to pop! (If you believe the narrative.) Yet the sector has trailed the S&P 500 for most of this bull market. But starting about halfway through 2014, Energy stocks began getting more expensive-quickly. P/Es since then have more than doubled, surging from 12.2 to 30.6-the richest valuation of any S&P 500 sector. So what happened? Did Energy stocks shoot to the moon? No! They cratered. Earnings just cratered more! Which means not only did Energy stocks fall a good bit, but now they sport rich valuations reality may not support.
Exhibit 1: Energy Earnings Per Share, P/E and Price Index
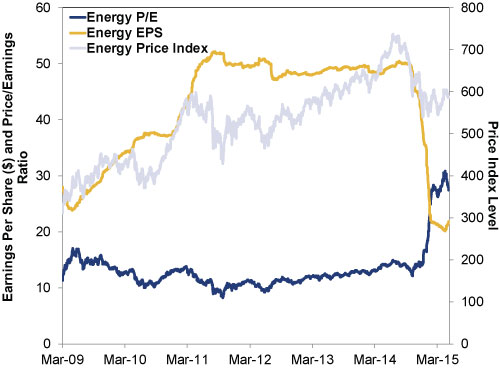
Source: FactSet, as of 5/19/2015. S&P 500 Energy Price Index, S&P 500 Energy Earnings Per Share and S&P 500 Energy 12-month forward P/E 3/9/2009-5/18/2015.
Here is another illustration-the Telecom sector. While the S&P 500's P/E hovered between 13 and 15 from May 2010 through August 2013, Telecom sector P/Es rose far above the broad index, hitting a high of 19.6 during that time. (Exhibit 2) Then, Telecom P/Es dropped to 12.7 by March 2014. So you might think Telecom stocks were overvalued in 2013 and have since fallen. But that wasn't the case-they mostly bounced along sideways. Earnings just rose a bunch during that period, which caused P/Es to drop. (Exhibit 3)
Exhibit 2: Telecom P/Es vs. S&P 500 P/Es
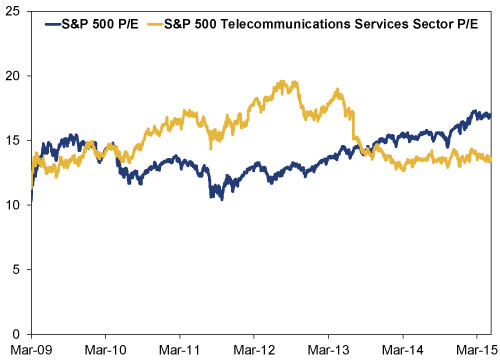
Source: FactSet, as of 5/19/2015. S&P 500 and S&P 500 Energy forward 12-month P/Es, 3/9/2009-5/18/2015.
Exhibit 3: Telecom Earnings Per Share, P/E and Price Index
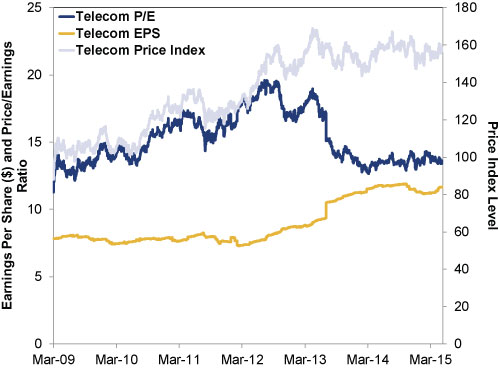
Source: FactSet, as of 5/19/2015. S&P 500 Telecom Price Index, S&P 500 Telecom Earnings Per Share and S&P 500 Telecom 12-month forward P/E 3/9/2009-5/18/2015.
Now, P/Es have their use-but only as a rough sentiment indicator, nothing else. Even in this way, though, P/E movement alone doesn't tell much about sentiment. You have to take the ratio apart, see how prices and earnings each moved, and then gauge how its readings stack up to other quantitative and qualitative sentiment measures. Energy, for example, has many pundits admonishing you to buy on the dip and ETF fund flows into the sector are high, yet fundamentals haven't markedly shifted. That high P/E could signal stocks are out over their skis. Telecom's low P/E may be a sign the industry faces headwinds from costly infrastructure build-outs and more. And most of that earnings-driven valuation reduction occurred years ago-it isn't a current or actionable trend.
Another major story this bull has debunked is the common belief high-dividend yielding stocks are superior to non-high-yielding ones. To believers, higher dividends mean more income, and more income is always better than less. In this cycle, folks figure this is particularly the case because low interest rates might make dividend payers even more attractive, juicing returns. But let's look at the data. If this seemingly sensible story were true, high-dividend stocks should have outperformed wildly in this bull market. And at times they have! But high-dividend payers have also underperformed at times, like most of the period 2012 to the present.
Exhibit 4: High-Dividend Vs. Regular Stocks
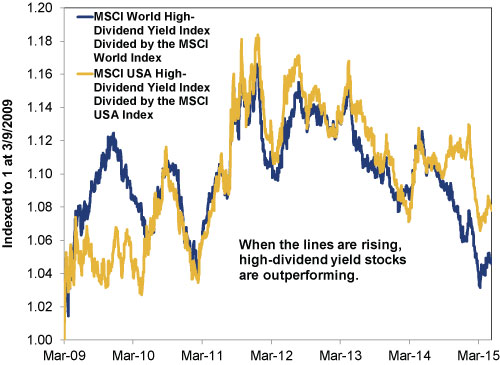
Source: FactSet, as of 5/20/2015.MSCI World Total Return Index net returns, MSCI World High-Dividend Total Return Index net returns, MSCI USA Total Return Index gross returns and MSCI USA High-Dividend Yield Total Return Index gross returns 3/9/2009-5/18/2015.
For roughly half this bull to date, high-dividend stocks outperformed, and for roughly half, they've trailed. Which should call into question both the notion dividend-paying stocks are permanently superior and the concept they are particularly so in this cycle due to low global interest rates. You see, it isn't like bond yields skyrocketed in 2012, driving underperformance. They've been up at times, down at others-but overall at extremely low levels throughout.
Dividends are just one piece of total return. Price appreciation-how much stocks rise over time-is the other. The fact that a stock pays a high dividend does not mean its total return will top a lower- or non-payer. (It also doesn't mean the stock will continue paying that high dividend, as they aren't set in stone or guaranteed.) Total return is what matters most to you, dear investor, because if the total return is higher you have more money working toward your goals-true whether you take withdrawals or not.
Narratives aren't facts, folks. They're just stories. They might be compelling stories. They might even be true! But before you invest based on a tale, it's best to determine whether that story is fiction or nonfiction.
[i] Price-to-earnings ratios. Sorry, we know this is the first use and it should be spelled out in the text, but we wanted to rhyme with bee's knees.
[ii] Not to mention preceding bull markets, but we digress.
If you would like to contact the editors responsible for this article, please message MarketMinder directly.
*The content contained in this article represents only the opinions and viewpoints of the Fisher Investments editorial staff.
Get a weekly roundup of our market insights
Sign up for our weekly e-mail newsletter.

You Imagine Your Future. We Help You Get There.
Are you ready to start your journey to a better financial future?

Where Might the Market Go Next?
Confidently tackle the market’s ups and downs with independent research and analysis that tells you where we think stocks are headed—and why.
Related Resources
-
Market Analysis On the June Inflation Cooldown2026-07-14
-
Expert Commentary 3 Things You Need to Know This Week | US Inflation, China GDP, US Retail Sales
 2026-07-13
 -
Weekly Wrap-Up Fisher Investments Reviews: Last Week in Markets—July 6 - July 102026-07-13
-
Expert Commentary This Week in Review | Global PMIs, SpaceX, RMD Planning
 2026-07-10


Learn More
Learn why 210,000 clients trust us to manage their money and how Fisher Investments and its affiliates may be able to help you achieve your financial goals.
As of 6/30/2026
New to Fisher? Call Us.
Contact Us Today