Personal Wealth Management / Market Analysis
Why You Shouldn’t Take Dr. Copper’s Prescription
Copper prices’ recent slide doesn’t spell trouble for markets, in our view.

If you happen to know any telephone wire thieves, you may have noticed them looking a little sad lately. One possible reason (aside from the fact living life on the lam can be stressful): Copper prices have plunged -16.5% from June 8 – August 2.[i] Aside from larcenists, this drop spooked many who view the metal as a barometer of global economic health. Copper (the logic goes) is a key ingredient in manufacturing and construction projects—and since it trades globally, falling prices could signal heavy industry is flagging around the world, potentially threatening growth and markets. Thanks to copper’s alleged forecasting powers, financial wags long ago conferred upon it an honorary economics doctorate.[ii] But there are two problems with this thinking, in our view: First, as a mere metal,[iii] its price movements don’t have special significance. Second, we think copper’s recent travails appear sentiment-driven—linked to ill-founded trade war fears—and unlikely to last.
Among the explanations media toss out for falling copper prices, most pertain to perceived problems in China, which consumes about 40% of the world’s copper output. The most commonly cited: An escalating US/China trade war choking off global commodity demand and economic growth. As evidence, pundits point to recent “disappointing” Chinese data—like GDP’s slight downshift (to 6.7% y/y in Q2 from 6.8% in Q1)[iv] or recently decelerating Fixed Asset Investment (which grew 6.0% in 2018’s first half, the slowest on record).[v] Business activity surveys also ticked down in July from June.[vi] To many, this is evidence of China withering under US tariffs’ onslaught—and thus using far less copper. Lastly, some fret a recently weaker yuan relative to the dollar makes copper more expensive for Chinese importers, crimping profits and investment. But in our view, all these explanations fall short, as they ignore sentiment’s role in setting short-term commodity prices. Like stocks, commodities are subject to near-term volatility but move cyclically on supply and demand in the longer term. Trade war chatter can ding sentiment—as can growth jitters. Chinese stocks—which entered a bear market earlier this year based on similar worries—are another exhibit in the case for sentiment’s short-term influence.
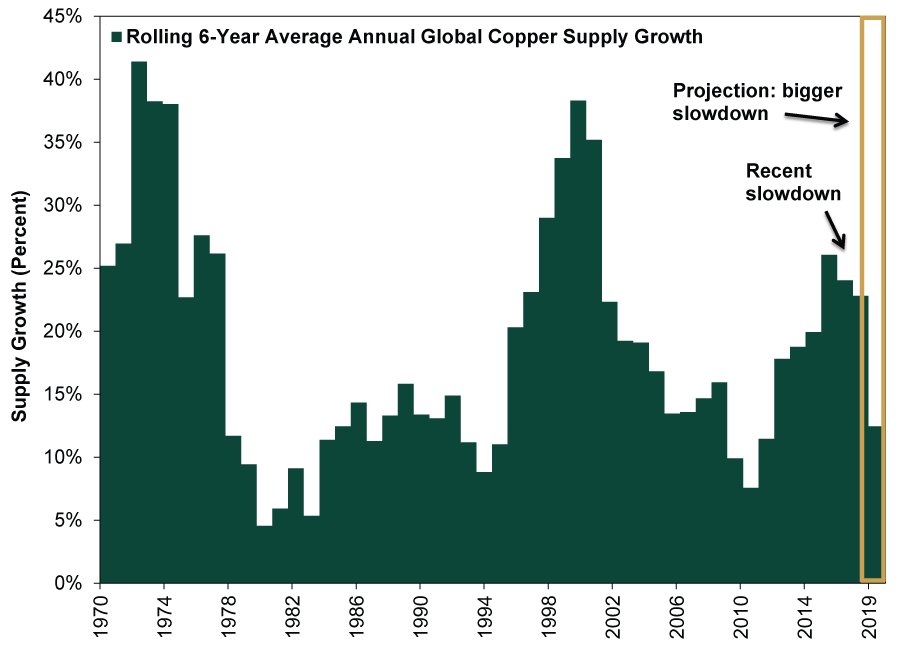
But in the longer term, fundamentals win out—and in our view, copper market fundamentals favor higher prices. First, as Exhibit 1 shows, copper supply growth is slowing today and should continue easing over the next few years.
Exhibit 1: Slowing Copper Supply Growth
Source: International Copper Study Group. Rolling 6-year average annual global copper supply growth, January 1970 – May 2018, plus projections for June 2018 – January 2020. Rolling 6-year average annual copper supply growth used as proxy for multi-year supply growth to smooth out yearly volatility.
Meanwhile, continued global economic growth supports stable metals demand. Recently announced fiscal stimulus in China probably adds to this, despite fears of heavy industry tanking. The stimulus aims to offset the effects of the recent shadow banking crackdown that previously curbed investment and growth. Overall, we think folks fixated on worst-case trade war scenarios miss these benign industry fundamentals and bid down copper.
As a result, we don’t think swinging copper predicts anything for the US economy or stocks—and not just because one liquid market can’t be more prescient than another. The fact is, Dr. Copper ain’t real—and historical data show it. Per Exhibit 2, there is no consistent link between copper prices and recessions.
Exhibit 2: Falling Copper Prices Not Predicting Recessions
Source: FactSet, as of 7/30/2018. Monthly high-grade copper prices alongside US recessions (as defined by the National Bureau of Economic Research), 1/3/1972 – 7/27/2018.
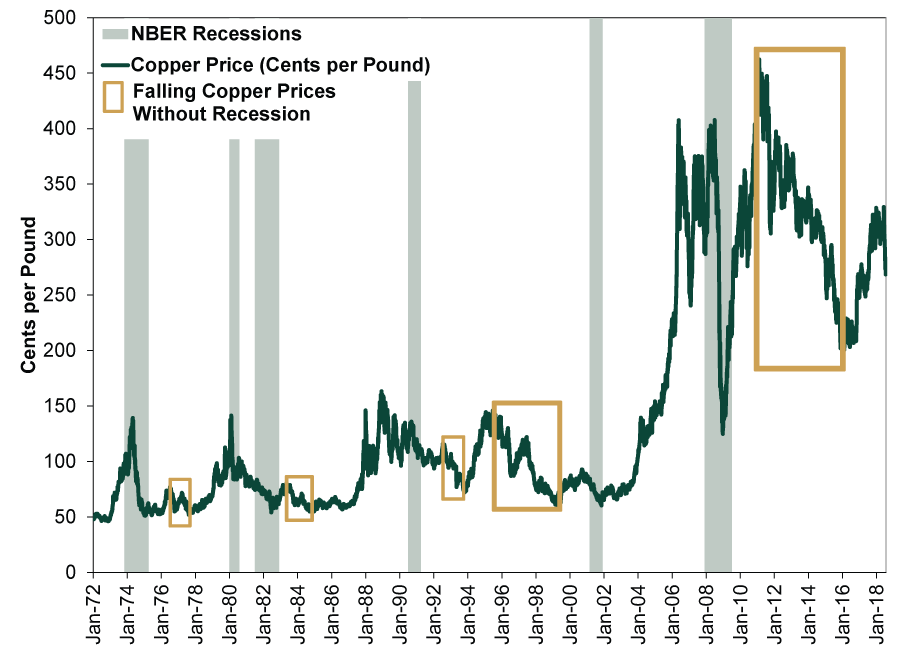
The most recent two predictive failures are particularly glaring. Copper prices fell for years in the mid-to-late 1990s while global markets boomed. The unprophetic metal also lost nearly 60% of its value between February 2011 and January 2016. Those who heeded the Doctor’s warnings during this time would have missed out on a big chunk of this bull market. Moreover, even if copper were predictive, drawing big conclusions from a few weeks of price movement would be myopic. Take another look at that exhibit: It shows copper prices frequently fluctuate hugely in the short term.
Stock markets aren’t the only realm in which Dr. Copper falls short. Copper and other industrial metals have outlived their usefulness as economic indicators, too. To be sure, in the mid-20th century when developed-world economies were more oriented to heavy industry, while not a perfect indicator, plunging copper prices could accompany a big economic pullback. But today, services and consumption dominate, especially in the developed world. It doesn’t take much copper to, say, sell advertising or give legal advice. Hence why industrial metals prices lost their place in the Leading Economic Index (LEI)—widely regarded (especially here at Fisher Investments) as a fine collection of forward-looking economic data points. As the 20th century wound down, the LEI moved on, first from metals and then from supposedly “sensitive” commodity prices in general. The moves made the LEI more forward-looking, in our view.
As far as China goes, the country does use lots of copper—and heavy industry growth there is slowing. But China is an Emerging Market, not a Developed Market, which means it isn’t very reflective of other major economies (or copper’s importance in them). Even in the Middle Kingdom, copper isn’t a great economic bellwether—see that 2011 – 2016 copper slump (during which the Chinese economy chugged right along) for more. This makes sense—services comprise just over half of the Chinese economy already, and its share is rising.[vii] Thus, we very much doubt a copper price plunge signals a hard landing is afoot in China, much less in this global expansion.
[i] Source: FactSet, as of 8/3/2018.
[ii] But for some reason, it is still ok (we checked) to make medical doctor jokes like the one in this headline.
[iii] Which is like a mere mortal, but shinier.
[iv] “China GDP growth slips to 6.7% in second quarter,” Gabriel Wildau, Financial Times, 7/15/2018. https://www.ft.com/content/f17e67e4-8646-11e8-96dd-fa565ec55929
[v] “China says its second-quarter GDP growth was 6.7%, meeting expectations,” Huileng Tan, CNBC, 7/15/2018. https://www.cnbc.com/2018/07/16/china-q2-gdp-china-posts-second-quarter-growth-data-amid-trade-war.html
[vi] “China's July manufacturing growth slows on trade dispute, softer domestic demand,” Staff, Reuters, 7/30/2018. https://www.reuters.com/article/us-china-economy-pmi-factory-official/chinas-july-manufacturing-growth-slows-on-trade-dispute-softer-domestic-demand-idUSKBN1KL03T
[vii] National Bureau of Statistics of China, as of 8/6/2018.
If you would like to contact the editors responsible for this article, please message MarketMinder directly.
*The content contained in this article represents only the opinions and viewpoints of the Fisher Investments editorial staff.
Get a weekly roundup of our market insights
Sign up for our weekly e-mail newsletter.

You Imagine Your Future. We Help You Get There.
Are you ready to start your journey to a better financial future?

Where Might the Market Go Next?
Confidently tackle the market’s ups and downs with independent research and analysis that tells you where we think stocks are headed—and why.
Related Resources
-
Market Analysis Reviewing Q1 Earnings and What Q2 Expectations Say2026-06-18
-
Market Analysis Kevin Warsh and the Magical Delete Button2026-06-17
-
Market Analysis The Politics and Practicalities of the Social Security Trust Fund2026-06-16
-
Market Analysis Gold Fails the Safe Haven Test Again2026-06-16


Learn More
Learn why 200,000 clients trust us to manage their money and how Fisher Investments and its affiliates may be able to help you achieve your financial goals.
As of 3/31/2026
New to Fisher? Call Us.
Contact Us Today