Personal Wealth Management / Market Volatility
10 Questions on Stock Market Volatility:
Explore This Article
Volatility is a word you'll often hear associated with the stock market. While many think of volatility as risk, it’s not one-sided: Volatility can be positive as well as negative.
Fisher Investments believes better understanding market volatility and its usual characteristics is crucial for investors. A firm grasp of this concept is essential for navigating the investment world’s many risks and opportunities. This page answers 10 common questions about stock market volatility, giving you enduring insights into what can feel like an ever-fluctuating financial world.
1. Why are stocks so volatile?
Every day, countless market participants buy and sell stocks based on their expectations for companies’ futures. Investors are constantly digesting new information—economic data, corporate earnings, geopolitical events and more—which contribute to stock price fluctuations.
While these ups and downs can feel unsettling, they are a normal part of how free markets work. As famous investor Benjamin Graham said, “In the short run, the market is a voting machine, but in the long run, it is a weighing machine.” What the stock market does on any given day, week or month may seem random, but over time, long-term pricing should reflect the fundamental value of an investment.
Ultimately, short-term volatility can be seen as the price of admission for capturing the superior long-term returns the stock market has historically provided to those disciplined enough to stay the course[i].
2. What is a normal amount of stock market volatility?
While volatility is a normal feature of stock markets, there’s no such thing as a normal amount of volatility. For example, single days where stocks move +/- 1% can vary significantly year-to-year. The chart below highlights daily moves greater than 1% each year since 2000, with the green bars indicating gains and yellow bars indicating declines. Some years see dozens of days with big moves, while others experience far fewer. But higher or lower volatility is never permanent and doesn’t predict the future direction of stocks.
Exhibit 1: Market Volatility is Normal
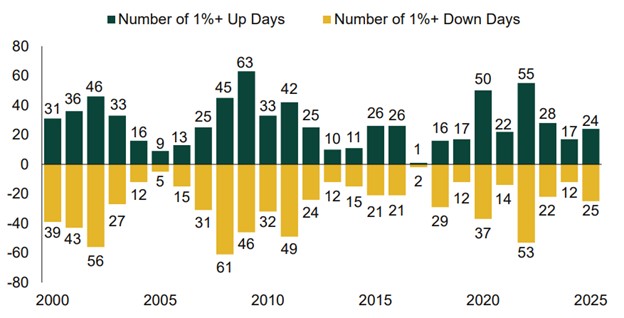
Source: FactSet, as of 2/5/2026. Total number of +/- 1% moves in MSCI World Price Index, daily, 1/1/2000 – 12/31/2025. Presented in US dollars.
3. Does market volatility indicate whether to expect a good or bad year for stocks?
No, there is no consistent pattern suggesting a shaky start, mid-year rough patch or even late-year drop determines how the year will end. Many years include material stock market declines at some point during the year. In the chart below, the purple bars show maximum intra-year stock market declines going back to 1998, while the green bars show where the year ended. Significant intra-year declines, such as in 2020 and 2025 didn’t prevent those years from ending with strong, double-digit returns.
Exhibit 2: A Good Year Does Not Mean a Calm Year
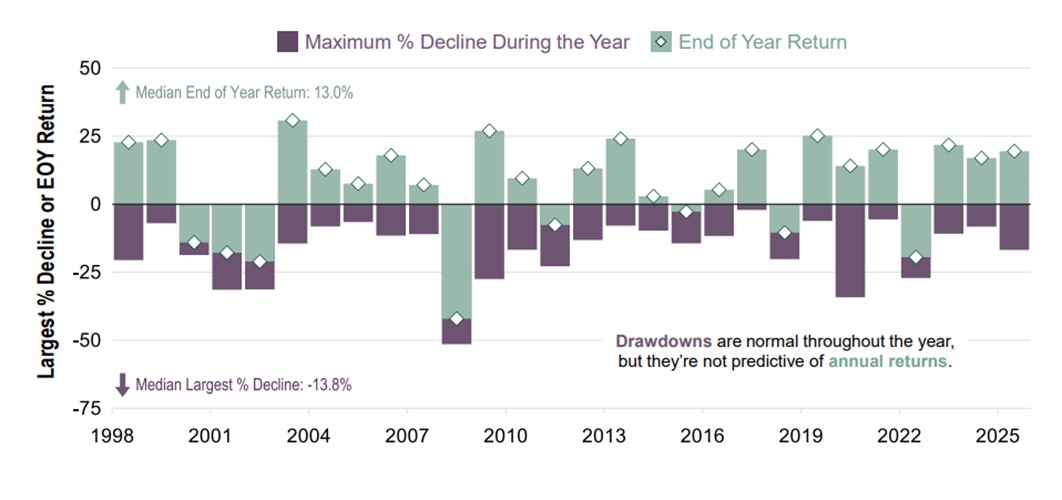
Source: Macrobond, as of 3/6/2026. Largest percentage decline within a year and end of year (EOY) cumulative returns. Figures calculated using MSCI World Price Index, daily, 1/1/1998 – 12/31/2025.
4. Are there different types of market volatility? If so, how can you tell the difference?
Yes, when thinking about negative volatility, we believe it’s helpful to break it down into three distinct types: pullbacks, corrections and bear markets.
- Pullbacks: These are the most common and least severe, involving short-term, market declines between -2% and -10%. They are typically driven by temporary shifts in investor sentiment rather than major economic problems.
- Corrections: These are sharper, sentiment-driven drops of -10% to -20%. While corrections often involve plausible or meaningfully negative events, investor sentiment typically overreacts to the issues at hand. The correction recovery usually occurs as investors gain additional clarity, realize the economic disruption likely isn’t as severe as was feared, or simply move past the issue after fully pricing it in.
- Bear Markets: This is the most severe type of market downturn, defined as a drop greater than -20% usually over a year or longer. Unlike pullbacks and corrections, bears often start slowly and don’t dramatically announce themselves. Bear markets typically begin grinding down amid an atmosphere where euphoric investors ignore deteriorating economic fundaments. Some bear markets can develop more quickly if triggered by a big, unforeseen negative shock—like a significant monetary policy error or disruptive government policy—that knocks several trillion dollars off the global economy.
Exhibit 3: Types of Negative Volatility
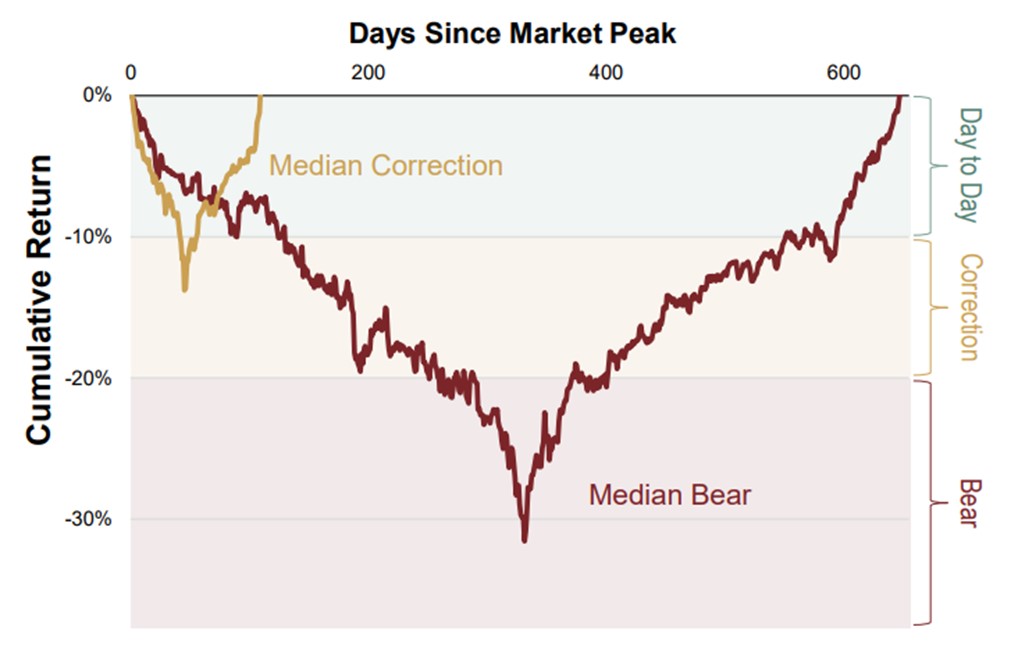
Source: Finaeon, Inc., FactSet, as of 9/10/2024. Median S&P 500 Price Index correction and bear market cumulative returns, daily, 1/3/1929 – 10/12/2022.
5. Should I try to sidestep market volatility?
In our view, trying to sidestep market volatility isn’t necessary for long-term investing success. Many investors attempt to trade around negative volatility by jumping in and out of the market, but doing so often comes at a cost.
If you’re trying to regularly sidestep volatility, you would need near-perfect timing because the drops—and the eventual recovery—often happen very quickly, sometimes in a matter of days or weeks. For example, in the 2018 and 2023 corrections shown below, surprisingly few trading days (orange segments) accounted for most of the market drops—followed by markets quickly surging (green segments). Given these often short and unpredictable market swings, we believe staying patient through corrections and pullbacks is prudent for most investors. By contrast, if you can reliably spot a bear market unfolding early, there may be opportunity to reduce equity exposure depending on the circumstances.
Exhibit 4: Short-Term Volatility Too Treacherous to Time
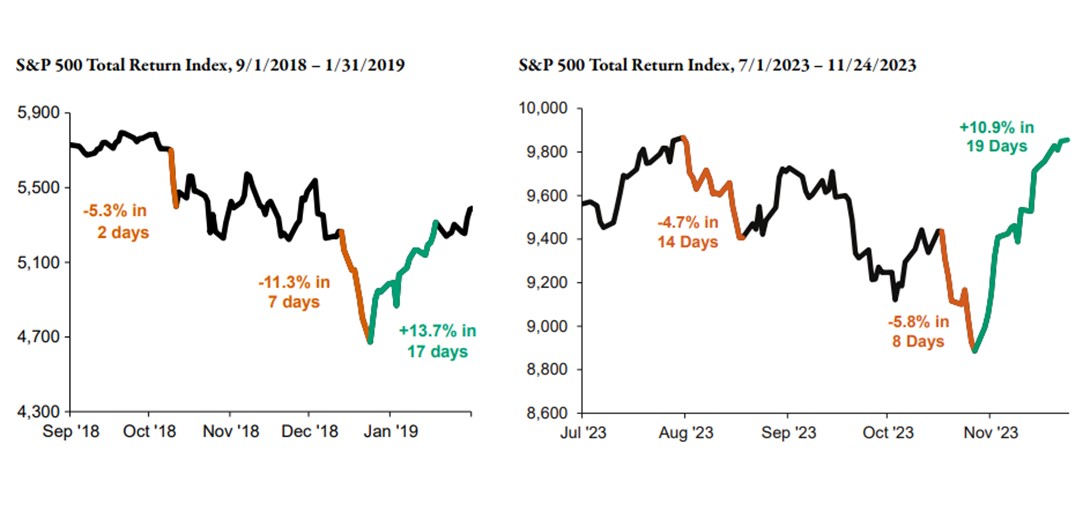
Left chart source: FactSet, as of 1/2/2020. S&P 500 Total Return Index, daily, 9/1/2018 – 1/31/2019.
Right chart source: FactSet, as of 11/27/2023. S&P 500 Total Return Index, daily, 7/1/2023 – 11/24/2023.
Learn how volatility could impact your portfolio
Request an Appointment
6. What if I don’t have enough time for markets to recover?
For those with a shorter investment time horizon, it may be prudent to hold a larger portion of your portfolio in fixed income and, potentially, cash-like investments. However, time horizon alone should not dictate your asset allocation. A holistic financial plan should also take into consideration your goals, objectives and cash flow needs. Speaking with a financial adviser can help determine what fits best for your needs.
A common misconception is assuming your investment time horizon ends on the day you retire. In reality, your investment portfolio may need to last for several decades beyond your retirement date, supporting not only you but potentially a spouse or heirs. So, while a market downturn in your early retirement years is uncomfortable, it’s important to remember your time horizon is likely much longer than you might think.
Basing retirement investment decisions on how you feel about short-term volatility risks missing the long-term compounding growth you may need to maintain your purchasing power over time. For most, the goal isn’t simply to make it to retirement, but through it by funding a lifestyle that may last for many years to come.
7. Should I use stop-losses to prevent bigger market declines?
In our view, stop-losses often hinder long-term investment growth by locking in losses. The strategy assumes recent price drops predict future declines, which is statistically unfounded. Worse, it can lead to selling during routine pullbacks or corrections, often just before a recovery begins. Instead of focusing solely on price movements, we recommend a holistic approach. Assess whether to hold or sell based on forward-looking political, economic, and sentiment drivers affecting a company’s fundamentals, as well as the security’s role within your broader portfolio.
8. Should I retire while the market is declining, or wait until stocks fully recover?
It depends. Deciding when to retire is a deeply personal choice, and whether a market decline impacts your retirement timing depends on the downturn’s severity and your unique financial situation. If your portfolio is well-funded, properly allocated and diversified, you’re likely in a good position to retire regardless of market conditions.
Here are some additional considerations for deciding when to retire:
- What are your income sources? A comprehensive financial plan should account for all income streams, including Social Security, pensions, passive income and investment accounts.
- What cash flow will you need from your investment portfolio? How much you can pull from your account without risking depletion predominantly depends on your asset allocation and market conditions. For a 100% equity portfolio, withdrawals below 5% are generally considered sustainable. Higher withdrawal rates may increase the risk of depleting your portfolio.
- Can you delay retirement or reduce withdrawals? While your portfolio may support retirement during a bear market, delaying or reducing withdrawals can enhance long-term growth. Taking less during downturns preserves more for future needs.
With proper planning, a well-constructed portfolio can help maximize the likelihood you can retire and maintain your planned cash flows, regardless of market conditions. Speaking with a financial adviser can help determine whether you are on track to reach your retirement goals.
9. I recently retired, will a big market downturn prevent me from reaching my goals? Should I consider returning to work?
Whether you should return to work or remain retired depends on your financial situation. Key factors include your income sources, the amount you need to withdraw from investments and whether your portfolio is well-funded, diversified and aligned with your goals. Speaking with a financial adviser can help you determine the best course of action for your situation.
Here are some important points to keep in mind:
- Markets Recover Over Time: Throughout history, even after significant declines, stocks have always recovered, reached new highs and continued growing.
- Long-Term Returns Are Resilient: Over the long run, stocks have averaged about 10% annual returns, though this includes periods of extreme ups and downs. From 1924 – 2025, stocks gained over 20% as often as any other outcome—about 39% of the time[ii].
- Bear Markets Are Temporary: When looking at 1-, 5-, 10- and 20-year returns after investing at the very top of each of the last 15 market peaks—the worst possible timing—1-year forward returns are negative on average, due to the ensuing bear markets. However, returns start to get more consistently positive after a couple years. Once you’re at 10- and 20-years after the initial bull market peak, stock returns bounce back towards long-term averages[iii].
- Missing Growth Is Riskier Than Bear Markets: Timing the market perfectly is nearly impossible, and missing out on market growth often poses a greater risk to long-term goals than enduring a bear market[iv].
10. Should I hold cash on the sidelines to be ready to “buy the dip” when volatility arises?
While cash is essential for covering near term expenses, holding excessive cash solely to “buy the dip” can be a costly mistake. Markets may rise significantly before the next decline, meaning even after a pullback, you could still end up buying at higher prices. Additionally, the best buying opportunities during a dip often occur when fear is at its peak—making it psychologically difficult for many investors to deploy their cash. In our view, time in the market is far more important than trying to time the market. Every day your capital sits on the sidelines, you miss out on potential compound growth, which is vital for achieving long-term financial goals.
Have another question about maket volatility?
Request an Appointment
[i] Source: Finaeon, Inc., as of 3/16/2026. Average rate of return from 12/31/1925 – 12/31/2025. Equity return based on Finaeon, Inc.’s World Return Index, Fixed Interest return is based on Finaeon, Inc.’s Global USD Total Return Government Bond Index.
[ii] Source: Finaeon, Inc., Macrobond, as of 4/2/2026. S&P 500 Total Return Index returns, yearly, 1924 – 2025.
[iii] Source: Finaeon; S&P 500 monthly total returns from 1/31/1928 - 12/31/1987. FactSet; S&P 500 daily total returns from 1/1/1988 - 5/12/2025, as of 5/13/2025. Due to limitations of data availability, forward returns calculated before 12/31/1987 use month-end start and end points. If the Bull Market Peak occurs before the 15th of the month, the calculation uses the previous month-end as the start point; if the Bull Market Peak occurs after the 15th of the month, the calculation uses the Bull Market Peak’s month-end as the start point. Presented in US dollars.
[iv] Source: Finaeon; S&P 500 monthly total returns from 1/31/1928 - 12/31/1987. FactSet; S&P 500 daily total returns from 1/1/1988 - 5/12/2025, as of 5/13/2025. Due to limitations of data availability, forward returns calculated before 12/31/1987 use month-end start and end points. If the Bull Market Peak occurs before the 15th of the month, the calculation uses the previous month-end as the start point; if the Bull Market Peak occurs after the 15th of the month, the calculation uses the Bull Market Peak’s month-end as the start point. Presented in US dollars.

Where Might the Market Go Next?
Confidently tackle the market’s ups and downs with independent research and analysis that tells you where we think stocks are headed—and why.
Insights & Media
-
Politics Blunting Burnham?2026-07-21
-
Expert Commentary 3 Things You Need to Know This Week | Q2 Earnings, ECB Meeting, Trump Accounts
 2026-07-20
 -
Weekly Wrap-Up Fisher Investments Reviews: Last Week in Markets—July 13 - July 172026-07-20
-
Market Analysis Pumping Up the Yen?2026-07-17


Learn More
Learn why 210,000 clients trust us to manage their money and how Fisher Investments and its affiliates may be able to help you achieve your financial goals.
As of 6/30/2026
New to Fisher? Call Us.
Contact Us Today