Personal Wealth Management / Market Analysis

About Those ‘Spiking’ French Yields

Fears of a French debt blowout look overblown.

French debt fears, like other developed markets’, are flaring. But as in America and elsewhere, we think a look at the data shows France is on fine footing. This looks like another false fear to us—part of this market’s bullish backdrop, particularly for non-US stocks.

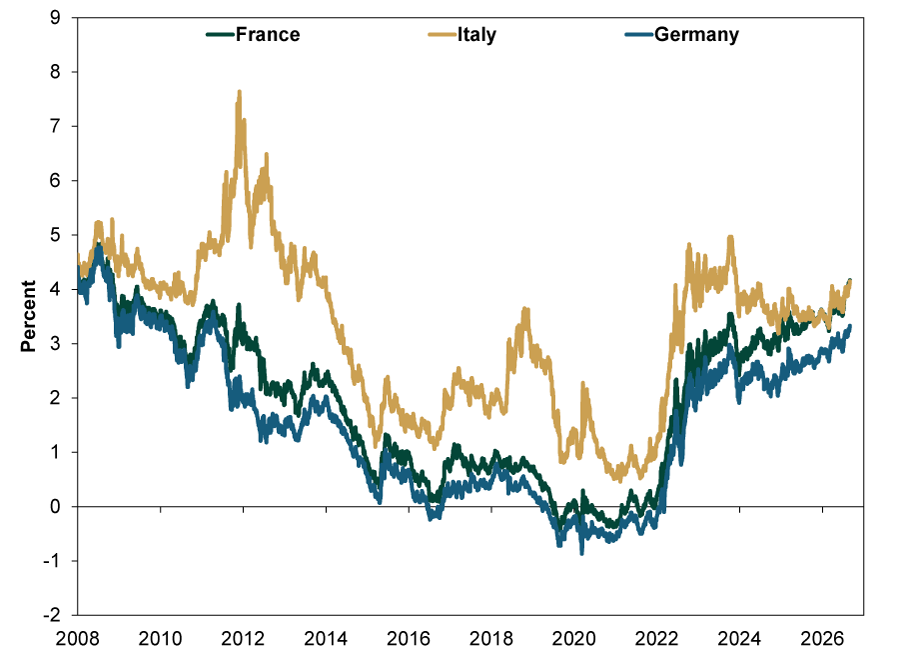
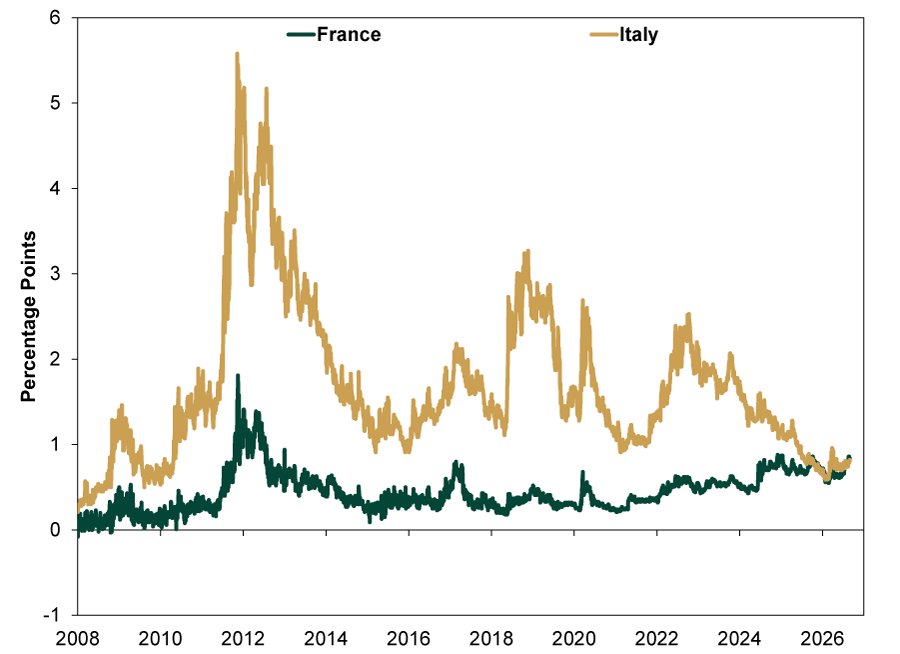
Many notice 10-year French yields hitting 4.17%, their highest since 2008. (Exhibit 1) This has them 0.84 percentage points above comparable German yields, a spread seen in 2012’s eurozone debt crisis. (Exhibit 2) Pundits conclude this is markets’ bracing for budget negotiations and next year’s presidential elections, both of which will allegedly worsen France’s financial standing. Meanwhile, ratings agencies warn France could face further downgrades following last fall’s budget brinksmanship if the government doesn’t stanch red ink and debt continues climbing.

Exhibit 1: France & Co.’s 10-Year Government Bond Yields
Line chart with three lines: dark green line for France, gold line for Italy, and blue line for Germany, showing 10-year government bond yields from January 2008 to August 2026.
•	Y-axis: Percent, ranging from -2% to 9%.
•	X-axis: Years from 2008 through 2026.
•	Dark green line (France): Begins near 4.2% in 2008, trends downward over the next decade, reaching approximately 0% in 2020. The line falls modestly below 0% during 2020 through 2022 before rising sharply in 2022. It ends near 4.2% in August 2026.
•	Gold line (Italy): Begins near 4.5% in 2008 and remains above France and Germany for most of the period. The line rises sharply during 2011 through 2012, peaking near 7.6%, before declining to around 1.1% by 2015. It then rises jaggedly, reaching a peak of 3.6% in late 2018 before falling irregularly to 0.5% in 2021, and then rising sharply in 2022, hitting almost 5.0% in 2023, pulling back and ending near 4.2% in August 2026.
•	Blue line (Germany): Begins near 4.3% in 2008 and trends lower than the other countries over time. The line falls below 0% between 2019 and 2022, reaching a low near -0.9% in 2020, before rising sharply in 2022. It ends near 3.3% in August 2026.
•	Italy remains the highest-yielding country for most of the period shown, but France overtook it in August 2026.
Source: FactSet, as of 8/31/2026.

The political facts here aren’t in dispute: Neither of the leading candidates for France’s April 2027 election is running on debt reduction. Rather, both tout policies that would lead to more fiscal largesse—an alleged “nightmare scenario” for financial markets.[i] Current polling leader Marine Le Pen rejects austerity to bring the budget under control, pledging France’s retirement age will stay at 62 (though she backs windfall taxes on Energy companies, few see this as a path toward fiscal health).

Current second-place candidate Jean-Luc Mélenchon promises to take €600 billion of French government bonds held by the Bank of France and wider Eurosystem, some 18% of the total, and “chuck it in the fire.”[ii] Critics say such debt cancellation would leave a gaping capital hole at the central bank. They say this monetizing the debt would spark white-hot French inflation and risk its ability to finance itself in markets more broadly. Some fear it would force France out of the eurozone. Quelle horreur! With so much fear, no wonder—it seems—benchmark 10-year French yields have overtaken Italy’s.

Exhibit 2: French and Italian Credit Spreads—Their Yields Minus Germany’s
Line chart with two lines: dark green line for France and gold line for Italy, showing the spread between each country’s 10-year government bond yield and Germany’s 10-year government bond yield from January 2008 to August 2026.
•	Y-axis: Percentage points, ranging from -1 to 6.
•	X-axis: Years from 2008 through 2026.
•	Dark green line (France): Starts near 0 percentage points in 2008 and remains generally below 0.5 percentage point through 2011. The line rises to a peak near 1.8 percentage points in 2012, then declines gradually to approximately 0.3 percentage point by 2015. It fluctuates mostly between 0.2 and 0.6 percentage point from 2015 through 2022 before trending higher. The line ends near 0.8 percentage point in early 2026.
•	Gold line (Italy): Starts near 0.3 percentage point in 2008 and remains between approximately 0.5 and 1.5 percentage points through 2010. The line rises sharply during 2011 and 2012, peaking near 5.5 percentage points, before declining steadily to around 1.2 percentage points by 2015. It fluctuates between roughly 1.0 and 3.2 percentage points from 2015 through 2024, with notable increases around 2018 to 2020 and again in 2022 to 2023. The line trends lower after 2023 and ends near 0.8 percentage point in August 2026.
•	Both lines remain above 0 percentage points throughout the period shown. Italy’s spread is consistently higher and more volatile than France’s spread for most of the chart, especially in 2011 – 2012, during the eurozone sovereign debt crisis. By August 2026, the spreads for France and Italy converge at approximately the same level, 0.8 percentage point.
Source: FactSet, as of 8/31/2026.

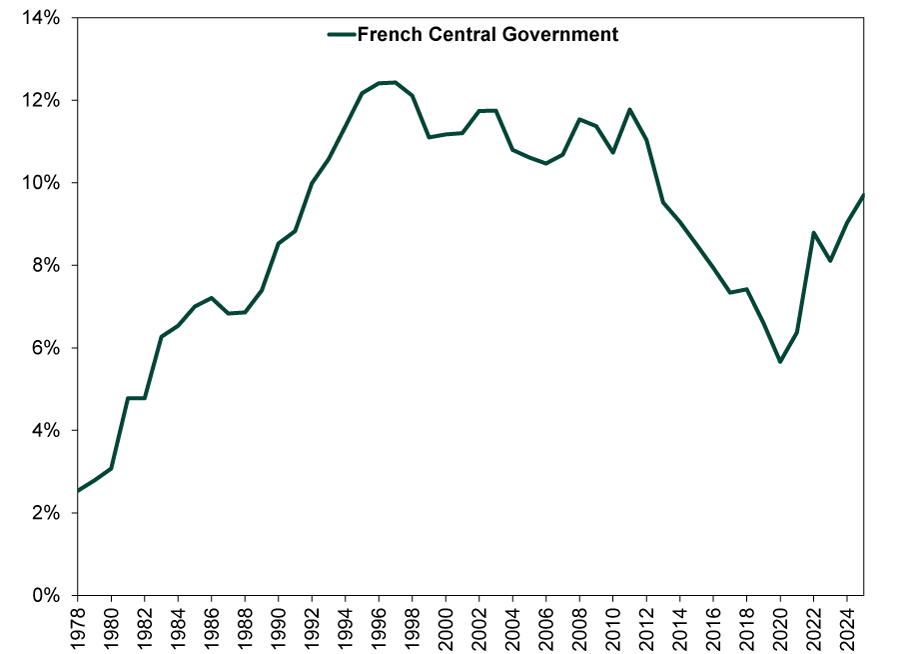
But beware extrapolating sentiment-fueled volatility as a fundamental shift. Strip away the hype, and France’s fiscal standing doesn’t appear so uncertain. As Exhibit 3 shows, French central government debt service is only 10% of its revenue. That is half the ratio of America’s, which isn’t cause for crisis considering some boom times accompanied similarly expensive US bond interest bills in the past. French debt service hovered between 10% and 13% of revenues throughout the late 1990s and early 2000s. France fared fine then and we doubt a return to those levels would be any different.

Exhibit 3: French Central Government Interest Payments Relative to Revenue
Line chart with a single dark green line labeled “French Central Government”, showing French central government interest payments as a percentage of tax revenue from 1978 to 2025.
•	Y-axis: Percent, ranging from 0% to 14%.
•	X-axis: Years from 1978 through 2025.
•	Dark green line: Starts near 2.5% in 1978 and rises steadily through the early 1980s, reaching approximately 6% by 1983 and 7% by the mid-1980s. The line continues upward through the early and mid-1990s, peaking near 12.5% between 1996 and 1998.
•	From 1999 through 2013, the line fluctuates between approximately 10.5% and 12%, with several local highs near 12% and lows near 10.5%.
•	Beginning in 2013, the line trends downward, falling from approximately 11% to a low near 5.5% in 2020.
•	After 2020, the line rises sharply, reaching roughly 8.8% in 2022, easing slightly in 2023, and ending near 9.7% in 2025.
•	The highest level occurs in the late 1990s at approximately 12.5%, while the lowest level occurs at the beginning of the series in 1978 at approximately 2.5%.
Source: Insee, as of 8/31/2026.

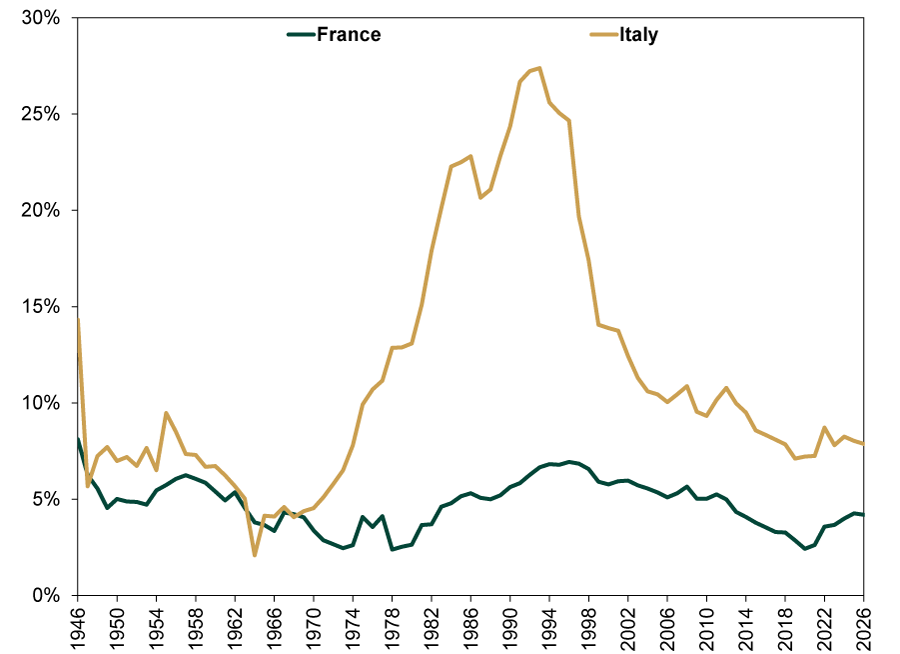
Or look at French general (including state and local) government debt service, which you can compare with Italy’s. (Exhibit 4) France is in finer fettle fiscally than Italy, which we think underscores the role sentiment, rather than fundamentals, is playing lately. While France’s interest coverage has deteriorated slightly, that isn’t specific to France, but rather part of a global trend as higher market rates filtered through to the debt stock. Regardless, austerity isn’t necessary for France’s bondholders to get paid, which is their overriding concern. Government revenues easily cover interest payments.

Exhibit 4: A Longer Look at—and Comparison of—General Government Interest Payments Relative to Revenue
Line chart with two lines: dark green line for France and gold line for Italy, showing general (including state and local) government interest payments as a percentage of tax revenue from 1946 to 2026.
•	Y-axis: Percent, ranging from 0% to 30%.
•	X-axis: Years from 1946 through 2026.
•	Dark green line (France): Begins near 8% in 1946 and declines to approximately 5% by the early 1950s. The line fluctuates between roughly 4% and 6% through the 1950s and early 1960s before falling to around 3% in the early 1970s. It rises gradually through the 1980s and 1990s, reaching a peak near 7% in the mid-1990s. Afterward, the line trends lower, fluctuating mostly between 4% and 6% through the 2000s and 2010s, reaching a low near 2.4% in 2020 before rising to approximately 4.2% by 2026.
•	Gold line (Italy): Begins near 14% in 1946, declines to approximately 6% by the late 1940s, and fluctuates between 6% and 9% through most of the 1950s. The line falls to around 2% in the mid-1960s before rising steadily through the 1970s and early 1980s. It increases sharply during the 1980s and early 1990s, exceeding 20% and reaching a peak near 27% in 1993. The line then declines substantially through the late 1990s and 2000s, falling to around 10% by the mid-2000s. It fluctuates mostly between 7% and 11% thereafter and ends near 8% in 2026.
•	Italy’s line remains above France’s line for nearly the entire period shown. The widest gap occurs during the early and mid-1990s, when Italy exceeds 20% while France remains near 6% to 7%.
•	By 2025, France is near 4% and Italy is near 8%.
Source: IMF and ECB, as of 8/31/2026. IMF data until 1994, ECB data thereafter. Note last data point for each series is for Q1 2026.
While it is possible this could change under new administration, in the sense that anything is always possible, we don’t think it is probable. What candidates do—and can accomplish—once in office often strays from what they say on the campaign trail. We agree that Mélenchon’s idea would be a disaster if put into practice. But the likelihood a Mélenchon-led coalition can push through debt cancellation is minimal. France’s fractured legislature can’t even agree on small fiscal policy tweaks, and this is orders of magnitude bigger.

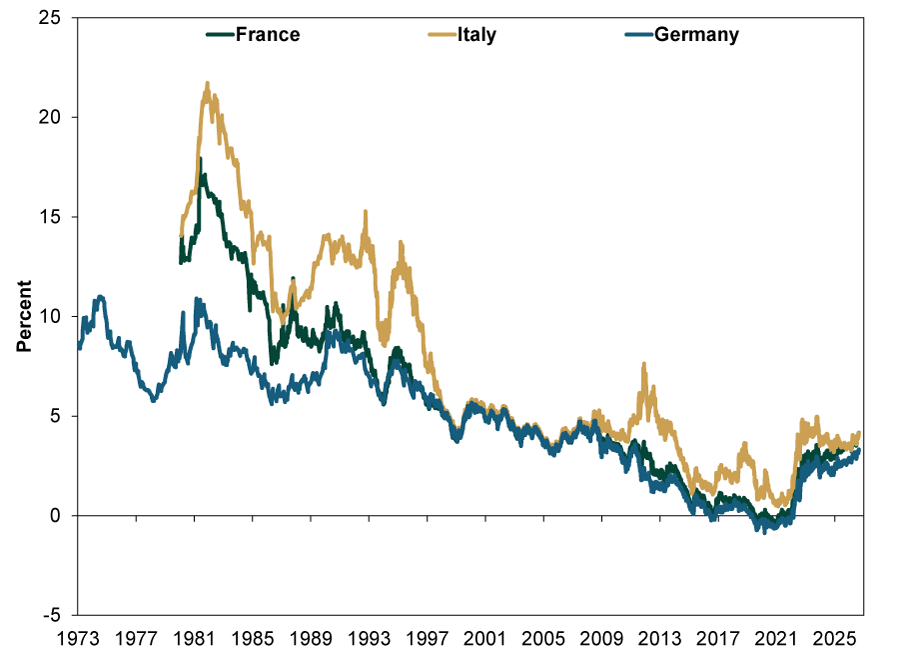
Still, headlines seem to insist a market reign of terror is inevitable—so what say markets? As Exhibit 5 shows, rates in France, like in the rest of the develop world, are up lately but remain at levels folks would have considered benign historically. Yes, spreads over Germany are at levels seen in 2012 ... when France didn’t default and wasn’t a focus of the eurozone debt crisis. So all in all, the uptick looks to us like another sign of bond markets’ return to normal after years and years of skew from central banks’ “quantitative easing” bond buying.

Exhibit 5: 10-Year Government Yields—Zoom Out for Perspective
Line chart with three lines: dark green line for France, gold line for Italy, and blue line for Germany, showing 10-year government bond yields from 1973 to 2026.
•	Y-axis: Percent, ranging from -5% to 25%.
•	X-axis: Years from 1973 through 2026.
•	Dark green line (France): Begins around 13% in 1980, rises to a peak near 17% in the early 1980s, then trends downward through 2021, falling below 8% in the early 1990s, 5% in the late 1990s and 3% in the 2010s. It falls below 0% around 2021 and then rises, ending near 4.2% in August 2026.
•	Gold line (Italy): Begins around 14% in 1980 and rises sharply to more than 20% in the early 1980s, before falling into a 9% to 15% range through the late 1980s and mid-1990s. After the late 1990s, it declines substantially, falling below 5% by the mid-2000s. The line rises to 8% in 2011 then falls into a roughly 1.0% – 2.5% range in the mid-2010s. It rises to 3.6% in 2018, falls to 0.5% in the early 2000s, rises sharply in 2022, peaking near 5.0% in 2023 and ends at 4.2% in August 2026.
•	Blue line (Germany): Begins near 8% in 1973, fluctuates between approximately 6% and 11% through the 1970s and 1980s, then trends downward over subsequent decades. The line falls below 2% in the early 2010s, drops slightly below 0% around 2020 through 2021 and rises afterward to end at 3.3% in August 2026.
•	All three countries show a long-term decline in 10-year yields from their early 1980s highs. France and Germany fall to approximately 0% around 2020 through 2021 before increasing again. Italy records the highest values throughout most of the period, particularly during the 1980s and 1990s. By August 2026, all three countries converge in a range of approximately 3% to 4%.
Source: FactSet, as of 8/31/2026.

French rates appear to be following global trends. Their crossover with Italy may seem momentous. But we think their convergence—again to historically benign rates—speaks more to improving sentiment toward Italy’s finances than France’s supposed pending bankruptcy. It looks to us like a sign of Italy’s improved credibility, not France’s sinking. (Note, too, Italy’s 2022 bond scare—like France’s today—didn’t amount to much either.)

Take a step back and fear recedes. Reality in France—like the rest of the developed world—isn’t as close to dire straits as whipped-up prognostications perceive.


[i] “French Borrowing Costs Hit Crisis Levels as Presidential Election Looms,” Chris Price, The Telegraph, 8/27/2026.

[ii] Ibid.


If you would like to contact the editors responsible for this article, please message MarketMinder directly.

*The content contained in this article represents only the opinions and viewpoints of the Fisher Investments editorial staff.

Get a weekly roundup of our market insights

Sign up for our weekly e-mail newsletter.

A couple talk with a business woman inside of an office with glass walls

You Imagine Your Future. We Help You Get There.

Are you ready to start your journey to a better financial future?

A dark green book cover with a title that reads "Stock Market Outlook." There is a sub-banner stating "Independent Research & Analysis. Published Quarterly by the Investment Policy Committee" ending with a fisher investments logo at the bottom.

Where Might the Market Go Next?

Confidently tackle the market’s ups and downs with independent research and analysis that tells you where we think stocks are headed—and why.

Learn More

Learn why 210,000 clients trust us to manage their money and how Fisher Investments and its affiliates may be able to help you achieve your financial goals.

As of 6/30/2026

New to Fisher? Call Us.

(888) 823-9566

Contact Us Today