Personal Wealth Management / Market Analysis
Lessons From Media’s Confusion Over Mixed UK Jobs Data
Media banter over how the BoE may interpret Q4 2017’s mixed unemployment data show the folly of trying to forecast central bankers’ actions.

One of media’s chief pastimes in recent years—and particularly in recent weeks, given the hyper-focus on inflation—seems to be speculating about what central banks will do in light of economic data releases. So it was with joy that we relished the massive confusion in the press as it attempted to discern exactly what Britain’s latest unemployment report meant for future BoE actions. Would the slight unemployment rate uptick delay hikes? Or would the higher-than-anticipated wage growth speed them? At times like this, it is worth remembering central banks’ actions cannot be forecast—they are people’s decisions, often biased and opinionated. Bankers decide which data to emphasize and which to downplay; which theories to operate on and which to ignore. Ultimately, the media fixation on what data mean for rate hikes is a sideshow for equity investors—one we hope you tune out.
First, the data. Britain’s unemployment rate ticked up 0.1 percentage point to 4.4% in Q4 2017—an unexpected increase, as economists forecast no change. This is still a very low unemployment rate by historical standards, close to the early 1970s’ record lows. Nevertheless, some economists said this uptick should delay BoE rate hikes, noting it moves Britain’s economy away from the 4.25% unemployment rate the BoE says will spur wage-driven inflation. (More on that concept to come.)
Yet here is the thing: The unemployment rate isn’t simply the percentage of the population out of work. Like America’s, Britain’s unemployment rate is the percentage of unemployed people who sought a job in the previous four weeks. If they didn’t seek work, they aren’t included—these discouraged people fall out of the labor force. In Q4, the unemployment rise wasn’t driven by increasing slack in the labor market. It wasn’t due to firings, layoffs or anything of the sort. Actually, 88,000 more people finished Q4 2017 employed than at its outset.[i] But 109,000 people rejoined the labor force. How, then, will the BoE see this uptick?
Similarly, many speculate higher-than-expected wage growth (2.5% y/y versus estimates of a second straight 2.4% reading) means wage-driven inflation is nigh.[ii] Yet this rate is still below CPI’s 3.0%, meaning on a real basis, wage gains are negative.[iii] Moreover, whether one sees a tighter labor market forcing wages up from here may also hinge on their interpretation of the unemployment uptick. How will the BoE weigh that? Data throughout Wednesday’s report were in conflict, leading to disparate potential conclusions.
But at a higher level, there is an even better reason to look askance at employment data’s influence on BoE behavior: Wages don’t drive inflation. As Nobel-prizewinning economist Milton Friedman famously put it, inflation is always and everywhere a monetary phenomenon—too much money chasing too few goods and services. Money doesn’t refer to wages—after all, your employer pays you with funds already included in the money supply. Rather, it refers to the total amount of money in the economy—including quasi-money, like commercial paper and loans. Unless economic output soars, a higher quantity of money changing hands more quickly will drive prices higher. It is simple supply and demand. As Elisabeth Dellinger wrote on these pages recently, the theory jobs and wages drive prices relies on a long-since debunked theory called the Phillips Curve. Friedman debunked this on theoretical terms in a legendary 1968 speech, showing it to be circular logic.[iv] The 1970s’ combination of simultaneous high inflation and high unemployment debunked a link between employment and inflation on decidedly non-theoretical grounds.
We suspect the previous discussion isn’t lost on BoE officials. So why do they talk up the link between jobs, wages and inflation? Sorry, but we can’t say. Perhaps politics bears the blame. Perhaps they merely choose to overlook the aforementioned theory and evidence showing labor’s influence on prices is limited at best. As we said early on, BoE officials are people.
For all these reasons, we believe speculating on how the BoE will interpret this quarter’s employment data—or any economic data—is fruitless. You can’t know. The good thing is, historically, you haven’t needed to. The BoE’s rate hike last year didn’t squash equities. Rate hikes in America also haven’t proven bearish since the Federal Reserve began this tightening cycle in 2015. These aren’t isolated incidents, either: Exhibit 1 plots every UK bank rate hike since 1970 (red circles) on the MSCI UK’s index level (in sterling). (We used a logarithmic scale, which plots equal percentage moves equally in order to facilitate seeing the movement.) Sure, some occur during or near the beginning of bear markets. But vastly more do not. In our view, overhyping UK rate hikes is likely to prove unnecessary, making attempts to forecast the BoE irrelevant.
Exhibit 1: UK Bank Rate Hikes and the British Equities
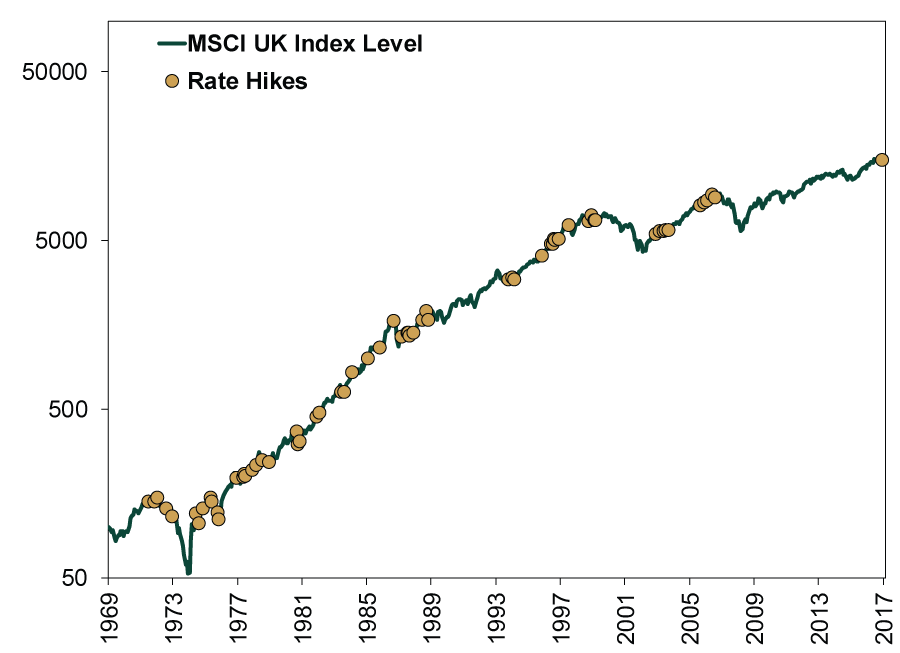
Source: FactSet, as of 2/21/2018. MSCI UK with gross dividends in GBP and the UK bank rate, December 1969 – January 2018.
[i] Source: Office for National Statistics, as of 2/21/2018.
[ii] Ibid.
[iii] Source: FactSet, as of 2/21/2018. UK Consumer Price Index, year-over-year percentage change in December and January 2018.
[iv] You can feel free to call it the Phillips Circle if you wish.
If you would like to contact the editors responsible for this article, please message MarketMinder directly.
*The content contained in this article represents only the opinions and viewpoints of the Fisher Investments editorial staff.
Get a weekly roundup of our market insights
Sign up for our weekly e-mail newsletter.

You Imagine Your Future. We Help You Get There.
Are you ready to start your journey to a better financial future?

Where Might the Market Go Next?
Confidently tackle the market’s ups and downs with independent research and analysis that tells you where we think stocks are headed—and why.
Related Resources
-
Market Analysis The New Tariffs in Town Are Still Old News2026-07-24
-
Expert Commentary This Week in Review | Market Volatility, Tariffs, SpaceX
 2026-07-24
 -
Economics A Summertime Check-in on US Consumers2026-07-23
-
Expert Commentary Why Ken Fisher Is Optimistic About European Stocks
 2026-07-23


Learn More
Learn why 210,000 clients trust us to manage their money and how Fisher Investments and its affiliates may be able to help you achieve your financial goals.
As of 6/30/2026
New to Fisher? Call Us.
Contact Us Today