Personal Wealth Management / Market Analysis
What Many Miss About US Debt Today
Inflation’s side effects are a silver lining as they pertain to debt’s affordability.

With the debt ceiling in the rear view, some have turned their attention to a related concern: US debt itself. The thinking: Yeah, America won’t default, but debt is still super high—setting up problems down the road. In all this debt fretting, many overlook a present fact: America’s debt-to-GDP ratio—one commonly used metric used to scale debt—is down considerably from 2020. Perhaps this overlooked development can help ease debt fears.
As of Flag Day, total US public debt outstanding (also known as gross debt) was $31.9 trillion.[i] Net public debt (which is debt held by investors and the Fed) was $25.1 trillion.[ii] As we have written before, focusing on net public debt is more useful since it excludes money the government owes itself (which effectively cancels). Either way, though, these are ginormous numbers. But size alone doesn’t indicate how big debt’s actual burden is. To do this, we must scale, or compare, debt to something else. Many economists compare debt to GDP, treating the latter as a stand-in for the country’s income. Now, we don’t think this is a great comparison since it is a stock-flow mismatch—i.e., debt accumulates over time while GDP is an annual flow of economic activity. But since the metric is popular and used worldwide, it is probably worth weighing anyway.
2020’s lockdowns crushed GDP—the denominator—while big COVID-relief spending boosted the numerator. Hence, debt-to-GDP surged from 108% in Q1 2020 to 135% the next quarter.[iii] But since that early-2020, one-off jump, the ratio has fallen. Why? Robust nominal GDP growth after the economy reopened. (Exhibit 1)
Exhibit 1: Debt-to-GDP, Q1 2019 – Q1 2023
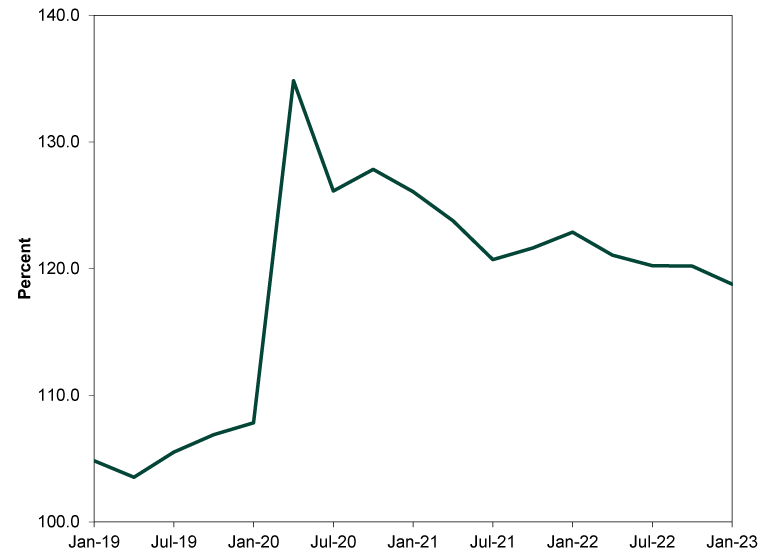
Source: St. Louis Federal Reserve, as of 6/14/2023. Total federal debt as a percent of GDP, Q1 2019 – Q1 2023.
As a refresher, US GDP—which tallies consumption, investment, government spending and net exports (exports minus imports)—can be expressed on a nominal (reflecting current prices) or real (inflation-adjusted) basis. We don’t recommend using nominal GDP to evaluate the economy’s health in real time since an economy growing less than the inflation rate isn’t preserving living standards, never mind raising them—it is a money illusion. But nominal GDP is a proxy for the tax base and debt is nominal, not real. So from a debt service standpoint, nominal measures are more real than real (ha).
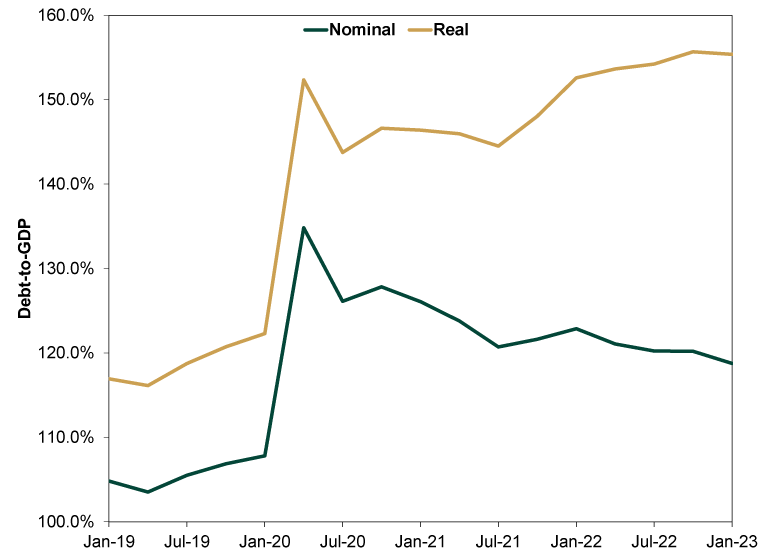
Debt is perhaps the one place where inflation is more good than bad. If the economy were in deflation, and real GDP were steady, the tax base would be shrinking—this is the situation Japan was in for many years. Inflation does the opposite, as comparing America’s nominal debt to both nominal GDP and real GDP illustrates. Now, the latter is a mismatch that doesn’t compare like with like, but we do so intentionally here to isolate inflation’s effects.
Exhibit 2: Debt-to-GDP on a Nominal and Real Basis
Source: St. Louis Federal Reserve and FactSet, as of 6/14/2023. Total federal public debt as a percentage of nominal GDP and total federal public debt as a percentage of real GDP, quarterly, Q1 2019 – Q1 2023.
Moreover, don’t underestimate how economic growth and inflation can reduce a country’s debt burden even if absolute debt keeps rising. In the early 1940s, American debt soared to fund the war effort. Though debt kept climbing after World War II’s conclusion, its share of GDP fell since the postwar economy grew and outpaced outstanding debt. (Exhibit 3) The UK also shows how an economy can outgrow its debt burden—even for bonds issued nearly a century ago.
Exhibit 3: The US Outgrew Its Postwar Debt
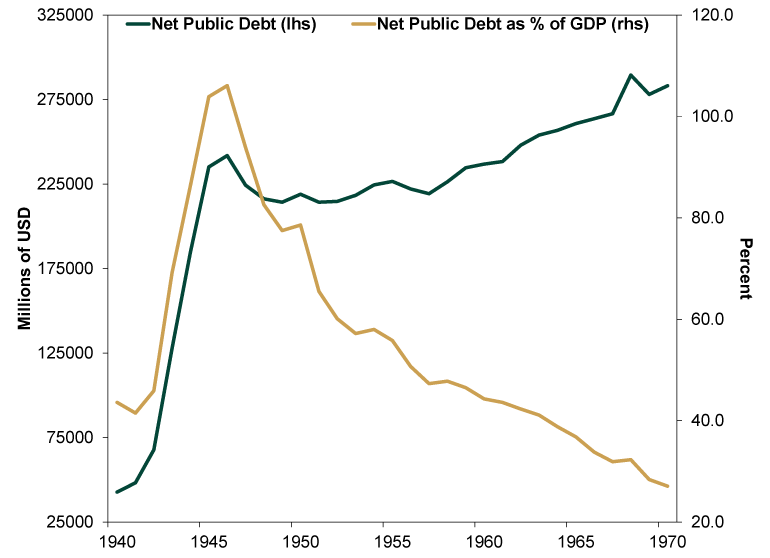
Source: Office of Management and Budget, as of 6/14/2023. US net public debt and net public debt as percentage of GDP, fiscal years 1940 – 1970.
A growing economy produces higher tax revenues, which governments use to service debt. Note, too, that the vast majority of interest payments are locked in at the dollar amount when the bond was issued. Outside Treasury Inflation-Protected Securities, or TIPS, US debt isn’t subject to inflation adjustments. Hence, these existing bonds become more affordable as nominal GDP—and revenues—grow.
In our view, the most accurate way to gauge debt’s affordability is how interest payments square with tax revenues. For all the hubbub about the amount of outstanding debt, interest payments’ share of federal tax receipts over the past 20 years has been relatively lower than the double-digit rates of the 1980s and 1990s—which was a pretty good time for the US economy and markets. (Exhibit 4) If debt’s affordability back then didn’t hamstring the US economy, we don’t see the case for why even more affordable debt is a problem now.
Exhibit 4: Today’s Debt Is Pretty Affordable
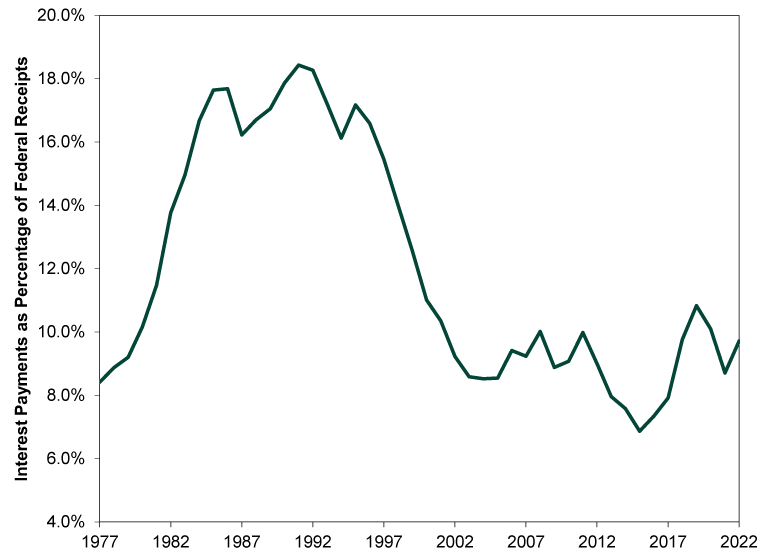
Source: St. Louis Federal Reserve, as of 6/14/2023. Federal outlays (interest) as a percentage of federal receipts, annual, fiscal years 1977 – 2022.
To be clear, we aren’t cheering elevated inflation and don’t dismiss the hardships households and businesses globally have endured due to higher prices over the past two years. It is frustrating to have inflation weaken your purchasing power. And we aren’t arguing the government should just spend, spend, spend. But we don’t see a sign of a debt crisis looming in these figures, a point inflation actually bolsters. In our view, this is why it is critical to refrain from viewing economic and market developments as inherently “good” or “bad.” Reality isn’t black and white—a fact markets recognize.
If you would like to contact the editors responsible for this article, please message MarketMinder directly.
*The content contained in this article represents only the opinions and viewpoints of the Fisher Investments editorial staff.
Get a weekly roundup of our market insights
Sign up for our weekly e-mail newsletter.

You Imagine Your Future. We Help You Get There.
Are you ready to start your journey to a better financial future?

Where Might the Market Go Next?
Confidently tackle the market’s ups and downs with independent research and analysis that tells you where we think stocks are headed—and why.
Related Resources
-
Economics A Summertime Check-in on US Consumers2026-07-23
-
Expert Commentary Why Ken Fisher Is Optimistic About European Stocks
 2026-07-23
 -
Politics Blunting Burnham?2026-07-21
-
Market Analysis Why the SOX “Bear Market” Isn’t Foreboding2026-07-21


Learn More
Learn why 210,000 clients trust us to manage their money and how Fisher Investments and its affiliates may be able to help you achieve your financial goals.
As of 6/30/2026
New to Fisher? Call Us.
Contact Us Today