Personal Wealth Management / Market Analysis
Checking In on Tariffs’ Trade Impact
Halfway through the year, tariffs have created winners and losers but don’t appear to have whacked US trade overall.

Trade war jitters spooked markets again on Wednesday, with the implication being that if tariffs aren’t going away any time soon, the world had better buckle up. With that in mind, we thought it might be helpful to highlight an interesting piece in Friday’s Wall Street Journal. It dissected tariffs’ impact on US trade year to date and included a neat chart showing how trade with various countries has changed. The headline finding: China is no longer the US’s top trading partner, dropping from 15.7% of total US trade in 2018 to 13.2% year to date through June. An interesting observation! But also not surprising, given the vast majority of new tariffs apply to bilateral trade between the US and China. Perhaps more meaningful for investors, the tariffs have created winners and losers, but they haven’t bushwhacked US trade overall. Hopefully, understanding how this works might help investors stay cool throughout this latest spate of market volatility.
Overall, there just isn’t much evidence tariffs are wrecking US trade. Total US exports are down just -0.9% year to date, as higher exports to Europe, India, Japan, Korea and Taiwan have more than offset the drop in exports to China.[i] If it weren’t for a -2.3% drop in exports to NAFTA (exempt from new tariffs) and OPEC (hurt by Venezuela’s turmoil and local economic troubles tied to weak oil prices), exports would be up year to date. Even the small drop is a rounding error relative to GDP. Literally. Exports are down by all of $7.8 billion year to date. Nominal GDP finished Q2 at $21.338 trillion.[ii] The tiny drop in exports is 0.037% of GDP, which rounds to zero. Exhibits 1 and 2 show the regional year-to-date change in exports, both in percentage and dollar terms.
Exhibit 1: Year-to-Date Percentage Change in US Exports
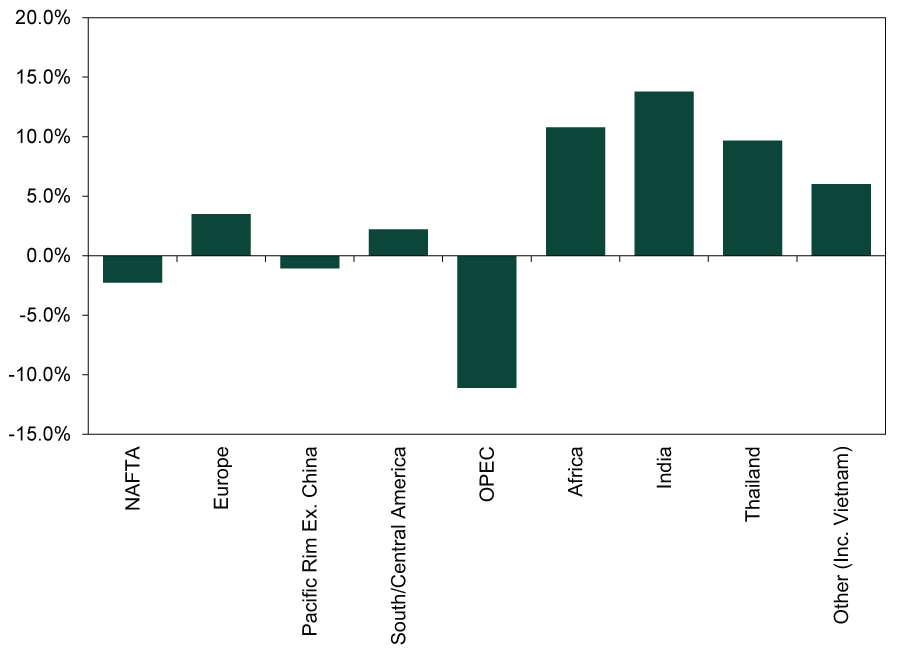
Source: US Census Bureau, as of 8/2/2019. Year-to-date year-over-year change in US exports, 12/31/2018 – 6/30/2019.
Exhibit 2: Year-to-Date Dollar Change in US Exports
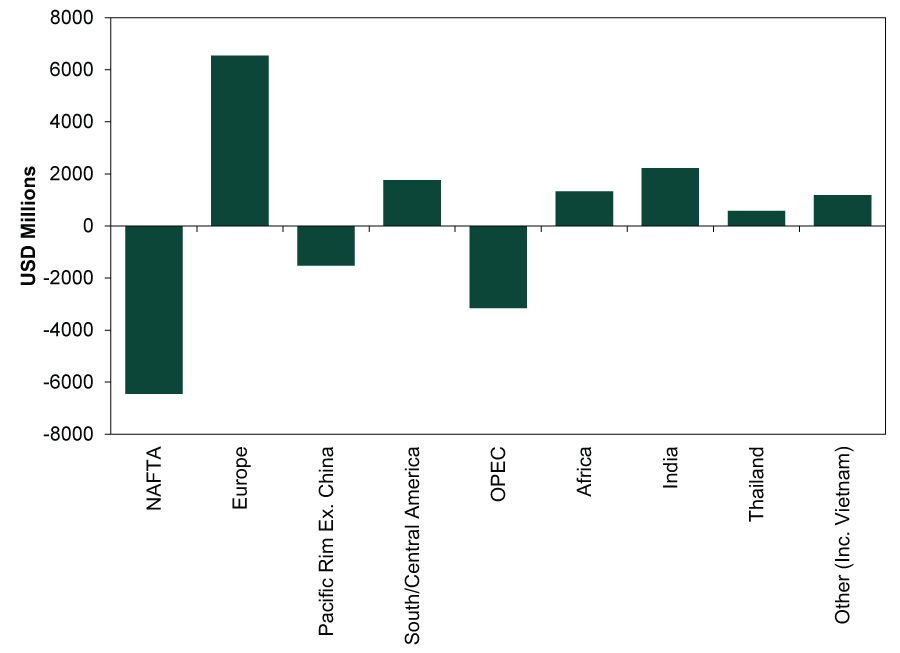
Source: US Census Bureau, as of 8/2/2019. Year-to-date year-over-year change in US exports, 12/31/2018 – 6/30/2019.
Meanwhile, imports are up—not by much, at just 0.3% year to date, but here too, tariffs haven’t crashed activity. This is where the international winners and losers start to play in. One big winner is Vietnam, which has benefited from geography as shippers’ preferred substitution hub. While US imports from China are down -12.4% year to date through June, imports from Vietnam jumped 33.4% from 2018’s first six months. Part of this, no doubt, stems from illegal methods of skirting tariffs, including transshipping and relabeling “Made in China” goods as “Made in Vietnam.” This is a practice governments on both sides are aware of and trying to combat, but in the meantime, it is a lifeline for many global supply chains.
Other big country winners include India (exports to the US up 10% year to date), Taiwan (another transshipping hub, with exports to the US up 21.0%) and Korea (up 10.7%). But at a regional level, the Pacific Rim isn’t the biggest winner. Excluding China, its collective exports to the US have risen 5.0% year to date.
Up more? Europe, with US-bound exports up 6.2% year to date. We find this to be a rather interesting counterpoint to the long-running narrative of struggling European manufacturing and trade. Yes, European factories have taken a hit from weaker demand in China, tied to the latter’s crackdown on nonbank lending last year (which hit the private sector), but demand from the US seems like an underappreciated positive. Particularly with the eurozone getting most of the apparent bump—eurozone exports to the US are up $12.9 billion year to date, or 6.8%.
Exhibit 3: Year-to-Date Percentage Change in US Imports
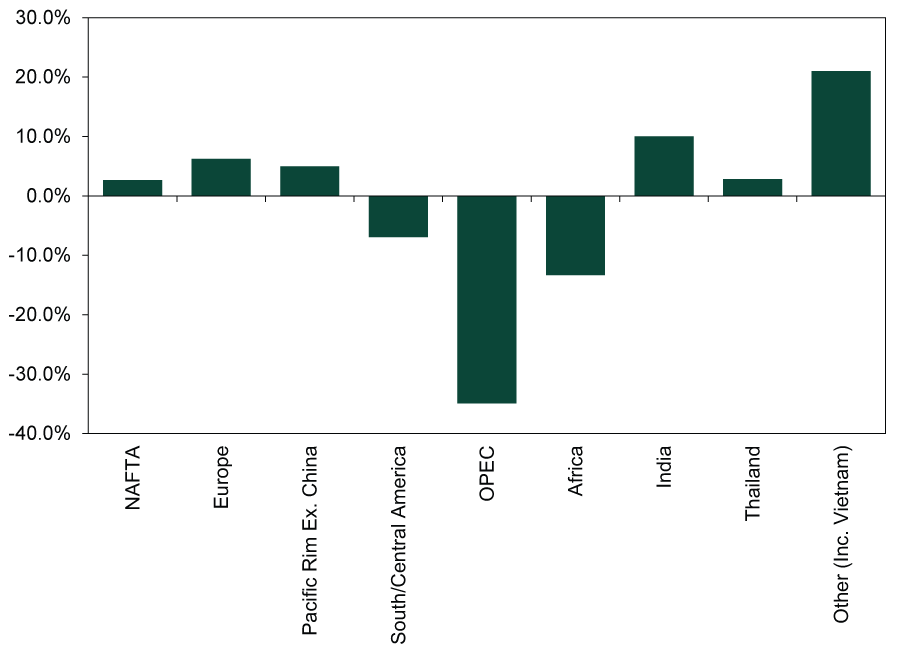
Source: US Census Bureau, as of 8/2/2019. Year-to-date year-over-year change in US imports, 12/31/2018 – 6/30/2019.
Exhibit 4: Year-to-Date Dollar Change in US Imports
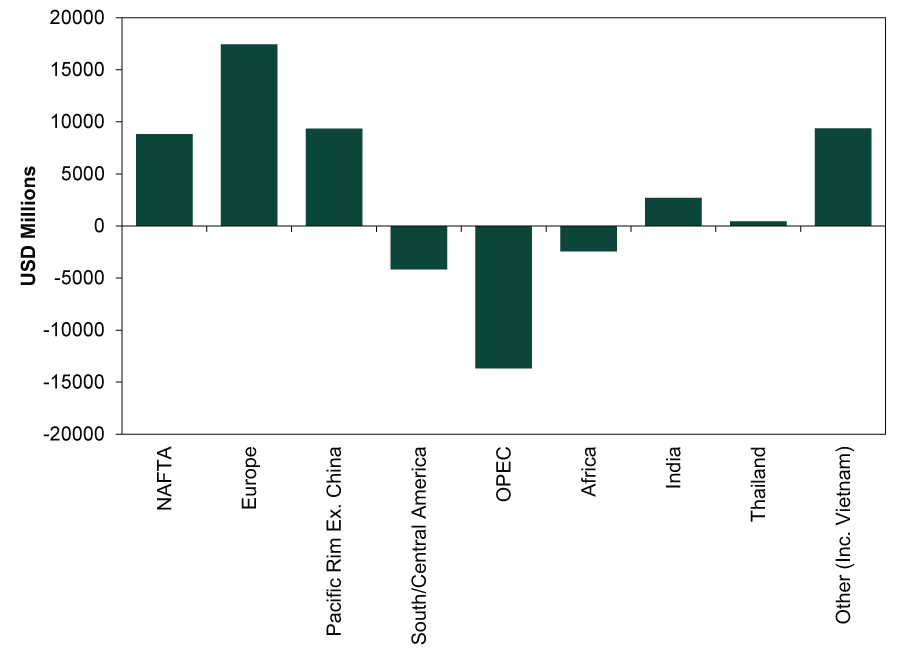
Source: US Census Bureau, as of 8/2/2019. Year-to-date year-over-year change in US imports, 12/31/2018 – 6/30/2019.
In short, the evidence doesn’t support the punditry’s incessant chatter over tariffs wrecking the US or global economy. Yes, we have seen the anecdotal evidence of individual businesses getting hit, and we don’t dismiss that. But markets are extraordinary at seeing through this sort of thing. Many of the businesses taking a hit are small companies or farms that don’t have the clout to rejigger supply chains in short order. Larger companies, which are what the stock market mostly measures, have more resources at their disposal, and we suspect their efforts are a big reason why the tariffs have largely just reshuffled America’s trade with individual countries, rather than how much we trade overall. As sentiment catches on to this better-than-expected reality, it wouldn’t surprise us if fading fears provided a tailwind for stocks.
[i] All trade numbers in this paragraph and the rest of the article come from the US Census Bureau’s June international trade release, which we linked to in the paragraph.
[ii] Source: US Bureau of Economic Analysis, as of 8/2/2019.
If you would like to contact the editors responsible for this article, please message MarketMinder directly.
*The content contained in this article represents only the opinions and viewpoints of the Fisher Investments editorial staff.
Get a weekly roundup of our market insights
Sign up for our weekly e-mail newsletter.

You Imagine Your Future. We Help You Get There.
Are you ready to start your journey to a better financial future?

Where Might the Market Go Next?
Confidently tackle the market’s ups and downs with independent research and analysis that tells you where we think stocks are headed—and why.
Related Resources
-
In The News What ‘IPO’ really stands for — and whether you should be buying SpaceX and the AI giants2026-06-23
-
Market Analysis Today in Brexit, Day 3,652: Brexit Turns 102026-06-23
-
Expert Commentary 3 Things You Need to Know This Week | Global PMIs, US PCE Inflation, Annuities
 2026-06-22
 -
Weekly Wrap-Up Fisher Investments Reviews: Last Week in Markets—June 15 - June 192026-06-22


Learn More
Learn why 200,000 clients trust us to manage their money and how Fisher Investments and its affiliates may be able to help you achieve your financial goals.
As of 3/31/2026
New to Fisher? Call Us.
Contact Us Today