Personal Wealth Management / Economics
Keep a Narrow Focus on October Jobs
What the October jobs report does—and doesn’t—tell investors.

Like many economic reports lately, experts searched for clues in last Friday’s US jobs numbers for whether the Fed’s rate hikes are cooling the economy—a fallacious practice, in our view. We suggest tuning out that noise and speculation and instead viewing the data in their own context. To us, doing so helps show the October jobs report simply confirms the labor market’s ongoing post-pandemic trend. We don’t suggest ascribing anything more to the data than that.
From the headline level, October’s jobs report was generally growthy. Nonfarm payrolls rose 261,000 after September’s revised 315,000 gain, beating expectations of a 200,000 increase. However, the unemployment rate ticked up to 3.7% from September’s 3.5%—higher than analysts’ expected 3.6% rate. The unemployment rate reflects the number of unemployed as a percentage of the labor force. Since the former rose in October while the latter fell a bit, a larger number of unemployed folks divided by a smaller labor force resulted in a higher percentage. While this might appear to contradict a jump in payrolls, a deeper dive into the Bureau of Labor Statistics’ (BLS) criteria reveals a more nuanced reality: The hiring data and unemployment rate stem from different surveys. The former is from the employer or “establishment” survey—the latter, the household survey. Since they reflect different data sources (about 131,000 businesses and government agencies versus about 60,000 households), it isn’t unusual for them to send seemingly conflicting signals.
One reason for this is that the BLS has specific definitions for what constitutes “unemployed”: Persons that aren’t employed—but available to work and have sought a job in the four-week period ending with the survey reference week (or were temporarily laid off and are expected to be recalled). Abnormal seasonal, industry and/or one-off (e.g., natural disasters) developments can impact who gets classified as “unemployed,” which can lead to volatile monthly readings—a reason we caution investors against painting broad brushstrokes based on one data point.
While many experts acknowledged the October report was solid, they also worried persistent payroll growth will force the Fed to keep hiking rates to cool the economy. We think this concern is rife with misperceptions, but it isn’t a surprising one, as it has been the standard take on growthy jobs reports this year. Rather than fixate on October’s numbers, we think investors benefit more by taking a broader view, as longer timeframes better reveal economic trends. In this context, October appears ordinary. Looking to the recent past, nonfarm payrolls were below the monthly average both this year and last year. (Exhibit 1)
Exhibit 1: Nonfarm Payrolls, Monthly Change, January 2021 – October 2022
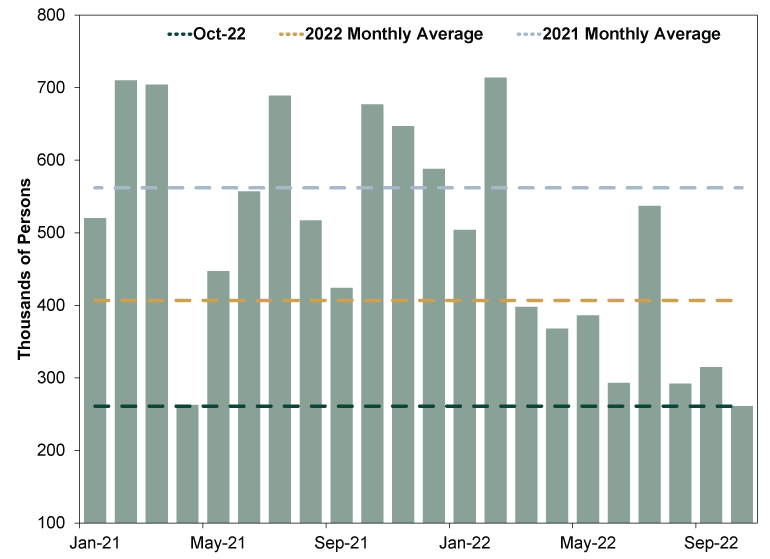
Source: FactSet, as of 11/7/2022.
But we don’t think that indicates really anything about the economy’s direction. Consider: During the 2009 – 2020 expansion, nonfarm payrolls averaged a monthly gain of 163,000. But they were pretty bouncy on a monthly basis, which the average glosses over. (Exhibit 2)
Exhibit 2: Nonfarm Payrolls, Monthly Change, June 2009 – February 2020
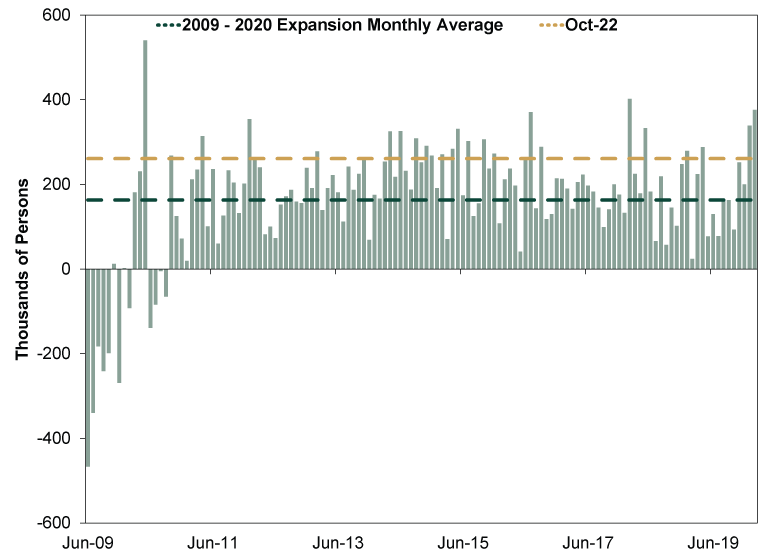
Source: FactSet, as of 11/7/2022.
As for the unemployment rate, October’s reading remained around historic lows and below the monthly average in the 30 years before the pandemic. (Exhibit 3)
Exhibit 3: Unemployment Rate, January 1990 – February 2020
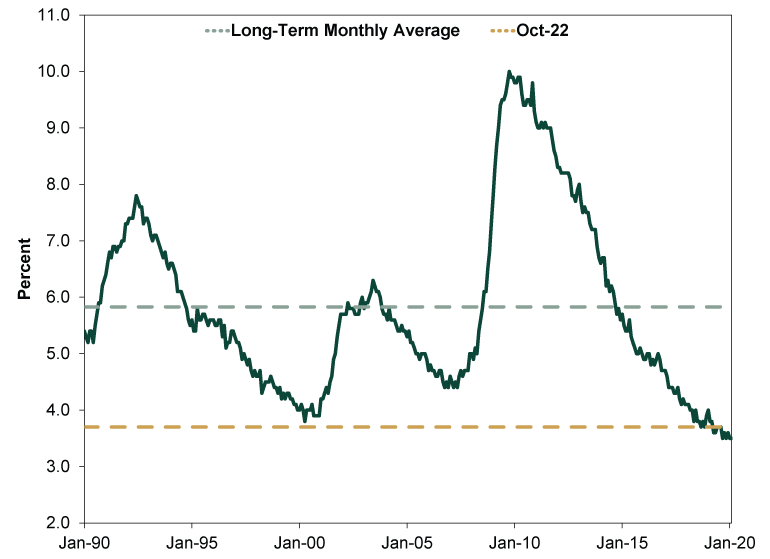
Source: FactSet, as of 11/7/2022. “Long-term monthly average” refers to monthly average from January 1990 – February 2020.
Another notable takeaway from October’s report: It shows the clear influence of the pandemic and associated lockdowns. See the return of jobs growth in industries hit hard by COVID restrictions, e.g., health care and hospitality industries. The former is back at pre-pandemic levels while the latter is on its way. (Exhibit 4)
Exhibit 4: Hard-Hit Industries Continue Recovering
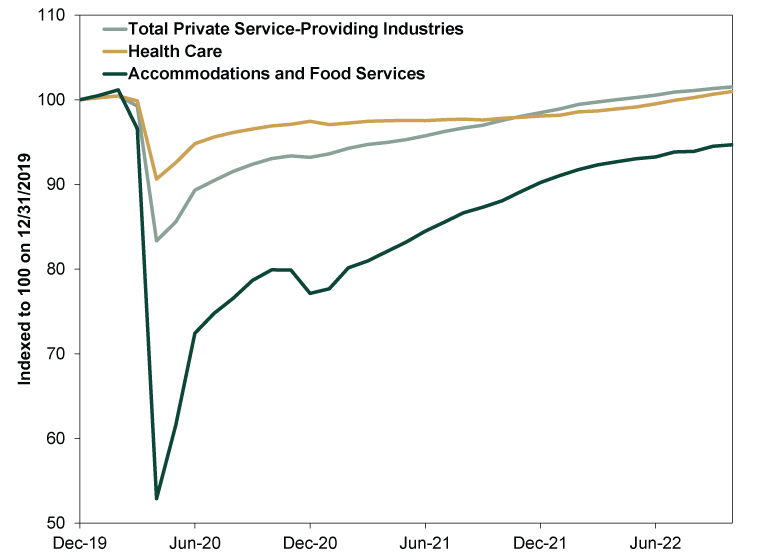
Source: FactSet, as of 11/7/2022.
The BLS collects a lot of data about labor markets, which can shed insight on a host of economic and sociological topics. This information can help confirm economic trends and illuminate the state of economic sectors or industries. But for investors, labor data are late-lagging economic indicators. That limits their usefulness for investment decision-making, since stocks care about where the economy is going—not where it has been. Changes in payrolls or the unemployment rate won’t reveal the economy’s direction or what the Fed will do next. Jobs data also won’t provide a fast read on how monetary policy is affecting the economy, as central bankers’ decisions affect growth at an undetermined lag—anywhere from 6 – 18 months.
Just because a widely monitored report receives a ton of headline attention doesn’t mean it is supremely meaningful for stocks. Jobs data are not only late lagging, they are widely watched—further mitigating their influence on stocks. So don’t ignore jobs, but don’t bestow them with influence that they don’t have, either.
If you would like to contact the editors responsible for this article, please message MarketMinder directly.
*The content contained in this article represents only the opinions and viewpoints of the Fisher Investments editorial staff.
Get a weekly roundup of our market insights
Sign up for our weekly e-mail newsletter.

You Imagine Your Future. We Help You Get There.
Are you ready to start your journey to a better financial future?

Where Might the Market Go Next?
Confidently tackle the market’s ups and downs with independent research and analysis that tells you where we think stocks are headed—and why.
Related Resources
-
Market Analysis Pumping Up the Yen?2026-07-17
-
Expert Commentary This Week in Review | US-Iran Conflict, US Inflation, New UK Prime Minister
 2026-07-17
 -
Market Analysis Business Friendly Bureaucracy or No, Britain is Growing2026-07-16
-
Economics Don’t Doubt the Old World2026-07-16


Learn More
Learn why 210,000 clients trust us to manage their money and how Fisher Investments and its affiliates may be able to help you achieve your financial goals.
As of 6/30/2026
New to Fisher? Call Us.
Contact Us Today