Personal Wealth Management / Market Analysis
Rising Rates Don’t Challenge Stocks
Short- and long-term rates are up some, but that doesn’t necessarily squeeze stocks.

There is no shortage of plausible-sounding financial theories—and many persist even despite repeated debunking. A popular one rearing its head again is that higher interest rates for cash and bonds mean stocks will fall out of favor. With 3-month, cash-equivalent Treasury bill yields over 2%—broadly matching inflation—and 10-year note yields making seven-year highs at 3.2%, the thinking goes these seemingly “risk-free” rates are attractive enough to lure folks out of stocks and end the bull. However, history shows this thesis has quite a few holes.
For one, we are sort of struggling to see why there is so much fuss over rising rates. Yes, 10-year yields took a bit of a jump on Wednesday. But this isn’t the sudden rise many are making it out to be. The 10-year US Treasury yield closed at 3.195% on Thursday. Before that, the highest level this year was 3.105% on May 19. So it basically took four and a half months for yields to rise nine basis points. That isn’t sudden. It is a snail trying to wade through a puddle of molasses. Overall, in our view, rising rate fears seem as off-base now as they were back in May. Long rates depend on future inflation, and all signs point to benign prices for the foreseeable future. Despite allegedly jumpy rates, the US yield curve has flattened over the past eight months, and the global yield curve has barely budged over the past year. This should keep money supply growth rather benign, which in turn should keep inflation from running away. And keep bond yields tame.
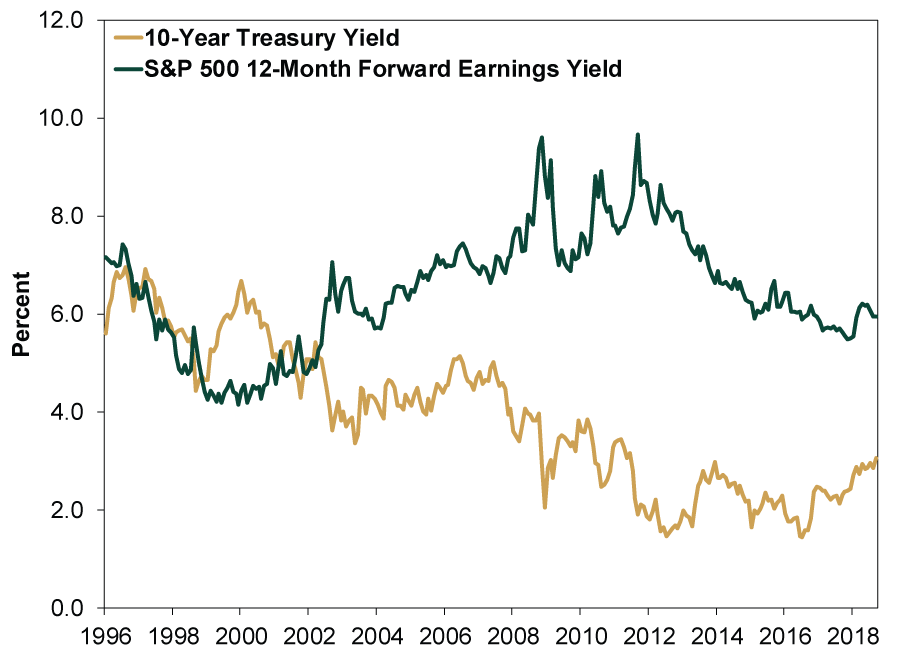
Even if yields simply hang around current levels, many believe they could dent stocks’ attractiveness. They compare stocks’ earnings yield—P/Es’ inverse (earnings divided by price)—with Treasury yields. The S&P 500’s 12-month forward earnings yield is about 6.0% now versus a 10-year Treasury’s 3.2%—a 2.8 percentage point spread.[i] Theoretically, this might suggest stocks are more attractive than bonds. A fine theory! But some point out this spread averaged more than a percentage point higher over the last few years, rendering today’s level less attractive. However, a much longer look at the earnings yield and bond yield shows no set relationship. Earnings yields have been consistently above bond yields since 2003—a fact that didn’t prevent a bear market from 2007 – 2009. Looking further back, bond yields were above earnings yields for much of the late-1990s—a fantastic time for stocks, making it hard to argue stocks were less attractive.
Exhibit 1: Stocks’ Earnings Yield Isn’t Correlated With Bonds’
Source: FactSet, as of 10/4/2018. S&P 500 12-month forward earnings yield and 10-year Treasury yield, January 1996 – September 2018.
Comparing stocks’ earnings yields to Treasury yields isn’t a timing tool. Nor does it come anywhere near predicting stocks long-term returns. Plus, historical long-term government bond total returns aren’t close to stocks’. If your long-term financial goals require equity returns, bonds won’t give you that. Many investors don’t see stocks and bonds as competitors, either. Rather, many long-term growth investors will own some bonds alongside stocks in order to dampen expected short-term volatility. Those arguing interest rates are a driver are setting up a false either/or choice.
To see stocks’ lack of relationship with bond yields another way, consider the “equity risk premium” (ERP), which states stock investors earn an extra return over risk-free government bonds to compensate for the additional volatility they endure. Fair enough, and history vets it out. Take stocks’ annualized total return over 93 years (good data starts in 1926), subtract 10-year Treasury’s returns over the same timeframe and you get 5.3 percentage points.[ii] But nothing about this is a timing tool. Stocks and bonds are both volatile in the short term. A couple years ago, when Treasury yields hit generational lows, folks feared that meant a long stretch of below-average stock returns was in store. But so far, we haven’t seen that. The S&P 500’s annualized return since 10-year yields hit 1.4% in July 2016 is 17.7%—well above the long-term average.[iii] This doesn’t thoroughly debunk the ERP-based claims from back then, as those were long-term forecasts, but it is illustrative.
Some also suggest cash is more competitive, too. But for the same reasons, cash is even less compelling than bonds for long-term investors. Short-term money market rates are starting to edge above inflation, depending on the inflation gauge. Which is (literally) better than nothing if you have funds in a money market—congratulations, you are preserving your purchasing power. So if you have a purchase coming up—say a down payment on a home—a money market fund is probably a fine place to park cash you know you will need soon. Better than before the Fed started hiking rates a few years ago. But if you are investing for the next 10, 20, 30 or more years, and you need long-term growth to meet your objectives, a return that barely beats inflation probably won’t get you there. Moreover, many institutional investors have pre-determined stock, bond and cash allocation mandates and won’t readily flip bond holdings to stocks just because a yield inches higher.
There are long stretches where stocks rise along with Fed rate hikes and bond yields. There are also times they don’t! Interest rate levels don’t dictate stock returns. Investors shouldn’t be led astray by them either.
[i] Source: FactSet, as of 10/4/2018.
[ii] Source: Global Financial Data, as of 10/4/2018. S&P 500 annualized return is 10.8%, from December 1925 – September 2018. The US 10-year Government Bond Total Return Index annualized return is 5.4%, from December 1925 – September 2018. The difference between the two is the ERP.
[iii] Source: Global Financial Data, as of 10/4/2018. S&P 500 Total Return Index, July 2016 – September 2018.
If you would like to contact the editors responsible for this article, please message MarketMinder directly.
*The content contained in this article represents only the opinions and viewpoints of the Fisher Investments editorial staff.
Get a weekly roundup of our market insights
Sign up for our weekly e-mail newsletter.

You Imagine Your Future. We Help You Get There.
Are you ready to start your journey to a better financial future?

Where Might the Market Go Next?
Confidently tackle the market’s ups and downs with independent research and analysis that tells you where we think stocks are headed—and why.
Related Resources
-
Market Analysis The New Tariffs in Town Are Still Old News2026-07-24
-
Expert Commentary This Week in Review | Market Volatility, Tariffs, SpaceX
 2026-07-24
 -
Economics A Summertime Check-in on US Consumers2026-07-23
-
Expert Commentary Why Ken Fisher Is Optimistic About European Stocks
 2026-07-23


Learn More
Learn why 210,000 clients trust us to manage their money and how Fisher Investments and its affiliates may be able to help you achieve your financial goals.
As of 6/30/2026
New to Fisher? Call Us.
Contact Us Today