Personal Wealth Management / Market Analysis
Yield Curve Inversion: What It Is & What It Means for Investors
Explore this Article:
- What Is a Yield Curve?
- What Is a Yield Curve Inversion?
- What Causes Yield Curve Inversions?
- What Role Do Central Banks Play?
- Analyzing Past Yield Curve Inversions
- Clearing Up Common Misconceptions
- What Do Yield Curve Inversions Actually Mean for Investors?
- Free Guides for Your Investing Journey
When financial news headlines start talking about a yield curve inversion it can sound ominous. Historically, inverted yield curves have often appeared before periods of economic slowdown, including the lead-up to the 2007-2009 global financial crisis.
But the relationship is not that straightforward. A yield curve inversion is one powerful indicator of recession risk, but it is a poor timing tool. Inversions can occur months or even years before a recession begins, while bear markets can begin well before or well after inversion. In some cases, bear markets and recessions have occurred with no inversion, while some inversions occurred with no recession.
For long-term investors, understanding what the yield curve is, why it sometimes inverts and how it fits into broader economic conditions can provide context to risks facing your portfolio.
What Is a Yield Curve?
The yield curve is a line that plots the yield on bonds of the same issuer across different maturities. For example, when you line up government bond yields from short-term bills to long-term bonds and connect them, you get that market’s yield curve. Central banks such as the Federal Reserve, European Central Bank, Bank of England and Bank of Japan influence the short end of these curves through changes in short-term interest rates while long rates are set by markets. The interplay between these forces determines whether the curve is steep, flat or inverted.
Exhibit 1: 10-Year – 3-Month Yield Curve and Recessions
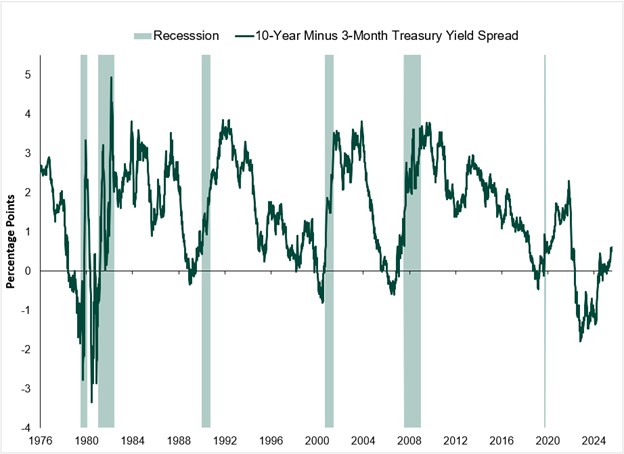
Exhibit 1 Long Description
This graph depicts a line showing the the 10-year minus 3-month Treasury Yield Spread in percentage points over the period from 7/2/1976 - 1/30/2026 with shaded sections representing periods of recession. The chart shows 6 periods of recession and 7 points where the yield curve inverted, meaning the 10-year rate was less than the 3-month rate. While these periods of inversion often precede periods of recession, it demonstrates that the severity of the inversions does not closely relate to the length of a recession and shows that the most recent did not.
Source: FactSet, as of 2/6/2026. US 10 Year Bond minus US 3 Month Bill, daily, 7/2/1976 - 1/30/2026.
In normal conditions the curve usually slopes upward. Investors typically demand a higher yield for longer term bonds, so long-term interest rates are usually above short-term rates. This is called a normal yield curve. A flat yield curve means the gap between short- and long-term yields has narrowed, often because demand for longer-term bonds has pushed their yields down or central banks have pushed yields on short rates up.
Commentators often track specific spreads to gauge inversion. A common example is the 2-year/10-year Treasury spread. At Fisher Investments, we typically emphasize the 3-month/10-year spread instead because the 3-month rate more closely reflects what banks pay on deposits. Both are ways of monitoring the same idea: the relationship between short-term and longer-term yields along the curve.
Check Your Retirement Readiness
Request an Appointment
What Is a Yield Curve Inversion?
A yield curve inversion occurs when short-term rates move above longer-term bond yields, reversing the curve’s usual upward slope. In that environment, part or all of the curve has a negative slope and short-term yields exceed long term yields.
Historically, inverted yield curves have often appeared before recessions, including in the lead up to the 2007-2009 global financial crisis. Because of that record, many view yield curve inversion as a leading indicator of a probable recession. Yet the relationship is not mechanical. Inversions are not precise timing tools and do not always precede recessions in a consistent way, nor do they predict the direction of the stock market.
What Causes Yield Curve Inversions?
Yield curve inversions usually reflect several forces working at once, including:
- Monetary policy: When central banks such as the Federal Reserve raise short-term interest rates rapidly, short-term yields on Treasury bills, money market instruments and similar short-term bonds tend to move higher. If long-term interest rates do not rise as much, or even fall, the yield curve can flatten and eventually invert.
- Inflation pressures: When inflation pressures are elevated, central banks may respond with higher interest rate levels to cool economic conditions. At the same time, if bond investors believe inflation will fall in the future or that slower economic growth lies ahead, they may be willing to accept lower yield on longer-term bonds. That combination (higher short-term rates and lower yield on long-term bonds) can contribute to yield curve inversion.
- Demand for longer-term bonds: When investors perceive rising recession risk, they may seek the relative safety of longer-term government bonds. The resulting demand can push longer-term yields lower. Meanwhile, short-term rates remain anchored by monetary policy and liquidity conditions. Over time that mix can cause the yield curve to invert even if long term interest rates remain above inflation.
- Interest rate levels vs relationships: A higher interest rate environment does not automatically create an inverted yield curve. Long-term bonds can also offer higher yield if investors demand additional compensation for inflation uncertainty or long-term economic risks. What matters for yield curve inversion is the relationship between short-term bonds and longer-term bonds, not the absolute level of rates.
What Role Do Central Banks Play?
Through monetary policy, central banks set short-term policy rates and shape expectations for future interest rate moves. Changes in policy rates filter quickly into money markets and short-term government bond yields.
Because monetary policy works with long and variable lags, central banks try to balance current inflation, employment and growth data with expectations for the future. When they raise rates to address inflation, short-term yields often move higher first. Longer-term yields reflect both current policy and expectations for future rate cuts or stability. If markets anticipate lower rates ahead, longer-term yields may rise less or decline, which can contribute to yield curve inversion.
Central banks can also influence the yield curve through balance sheet policies such as large-scale purchases or sales of longer-term government bonds. Those actions can put downward or upward pressure on long-term yields and affect the slope of the yield curve over time. For investors, the key point is that monetary policy, inflation and growth expectations all feed into yield curve inversion risk, but markets are forward-looking. By the time policy has produced an inverted yield curve, equity markets have usually incorporated much of that information into pricing already.
Analyzing Past Yield Curve Inversions
While yield curve inversions have historically been a reliable recession indicator, recessions and bear markets are not the same thing and when it comes to both recessions and bear markets, yield curve inversions are a poor timing tool. For example, in the mid-2000s, the US Treasury yield curve inverted as short-term rates rose and longer-term yields stalled. The 2007-2009 global financial crisis followed, but not immediately. Equity markets initially continued to rise after inversion before eventually falling into a bear market as stocks priced in the corresponding recession that followed.
Meanwhile, in 2022, global stocks fell into a short and shallow bear market from January to October. In that case, the 3-month/10-year yield curve inverted in October, just as the bear market hit bottom. That yield curve inversion proved to be the longest in history, and yet a new bull market was born the same month with stocks going on to hit several record highs before the inversion ended. Additionally, despite the record-breaking inversion and short bear market, there was no corresponding recession.
Taken together, these episodes show that while yield curve inversions have often appeared around bear markets and recessions, they have not provided precise guidance on timing, depth or market impact. They are one useful piece of context rather than a stand-alone roadmap for what happens next.
Put Market Volatility in Perspective
Request an Appointment
Clearing Up Common Misconceptions
Because yield curve inversion gets so much attention, several misconceptions persist:
- “Yield curve inversion always means recession is imminent.” History shows that is not the case. The time between yield curve inversion and a recession can vary widely, and in some instances no recession followed at all.
- “All inversions are equal in severity.” Different episodes vary in depth, duration and the share of the yield curve that is inverted. A shallow, short-lived inverted yield curve is not the same as a deep, long-lasting negative slope across many maturities.
- “Investors should de-risk equity portfolios when inversion appears.” Yield curve inversion is not a signal to automatically move out of stocks or into cash. Making significant changes based solely on one economic indicator can increase the risk of missing market gains.
- “Yield curve inversions predict stock market direction.” The stock market responds to many factors beyond treasury yields, including corporate earnings, valuations and shifts in global sentiment. Inversions sometimes appear before bear markets, but they can also occur after stock declines.
What Do Yield Curve Inversions Actually Mean for Investors?
Interest rate conditions and bond market pricing are always shifting. Higher yield or lower yield environments can change the income available from government bonds, corporate bonds and other fixed income instruments, which may influence cash flows for investors who rely on bond income.
Ultimately, the yield curve is just one of many economic variables influencing the economy and stocks. While it’s worth paying attention to, we caution investors from making investment decisions based on the yield curve alone. In our view, successful retirement planning depends more on portfolio size, asset allocation, income streams, spending needs and time horizon than on a temporary negative slope in the yield curve.
Markets are also forward-looking. By the time an inverted yield curve becomes a widely discussed recession indicator, equity markets may have already priced-in much of that information. Waiting for the curve to normalize before investing can mean missing part of a recovery if a bear market has already ended or missing out on potential gains if one never develops.
History suggests that time in the market has often mattered more than reacting to individual signals. Understanding how different interest rate environments affect short- and long-term bonds can inform views on risk, income and diversification, but those decisions typically flow from overall financial goals rather than from any single indicator.
Free Guides for Your Investing Journey
If you would like to explore these topics further, Fisher Investments offers a range of free investing guides that cover market history, retirement income planning, portfolio strategy and more. These resources can help you put concepts like yield curve inversion in a broader context as you think about your long-term financial goals.
Explore and download our investing guides.This article is for informational and educational purposes only and should not be construed as investment advice or a recommendation regarding any particular investment strategy or course of action. The information presented is general in nature and does not take into account the individual circumstances, objectives, or financial situation of any specific investor. We provide our general comments to you based on information we believe to be reliable. There can be no assurances that we will continue to hold this view; and we may change our views at any time based on new information, analysis or reconsideration. Some of the information we have produced for you may have been obtained from a third-party source that is not affiliated with Fisher Investments.
Fisher Investments has no duty or obligation to update the information contained herein.

You Imagine Your Future. We Help You Get There.
Are you ready to start your journey to a better financial future?

Where Might the Market Go Next?
Confidently tackle the market’s ups and downs with independent research and analysis that tells you where we think stocks are headed—and why.
Insights & Media
-
Market Analysis On the June Inflation Cooldown2026-07-14
-
Expert Commentary 3 Things You Need to Know This Week | US Inflation, China GDP, US Retail Sales
 2026-07-13
 -
Weekly Wrap-Up Fisher Investments Reviews: Last Week in Markets—July 6 - July 102026-07-13
-
Expert Commentary This Week in Review | Global PMIs, SpaceX, RMD Planning
 2026-07-10


Learn More
Learn why 210,000 clients trust us to manage their money and how Fisher Investments and its affiliates may be able to help you achieve your financial goals.
As of 6/30/2026
New to Fisher? Call Us.
Contact Us Today