Institutional Investing / Economics
Infographic: Are Chinese Regulatory Fears Overblown?
To share this infographic on your website, use the embed code provided below.
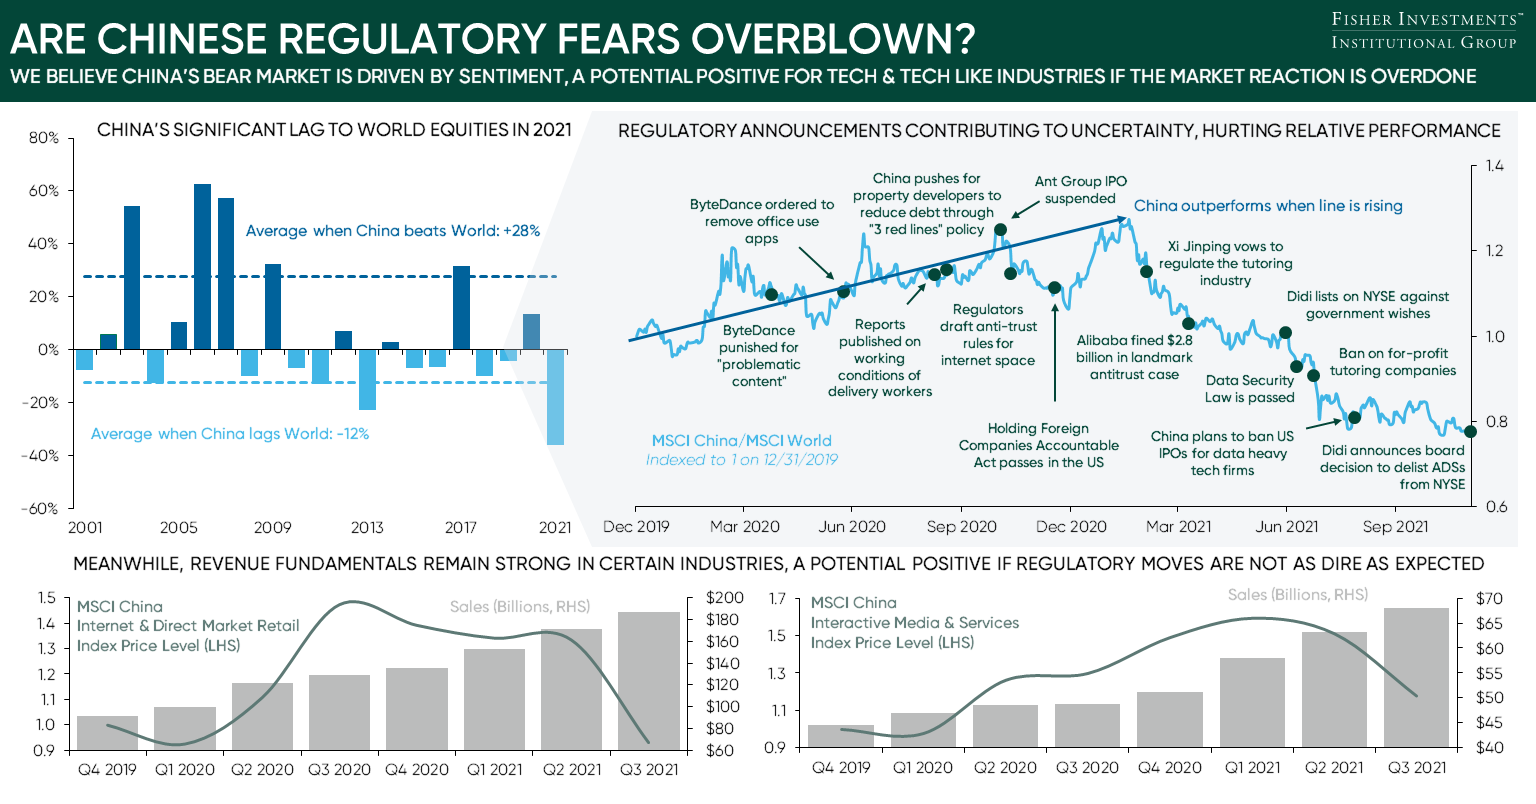
We believe China’s bear market is driven by sentiment, a potential positive for Tech and Tech-like industries if the market reaction is overdone.
Fisher Investments (FI) is an investment adviser registered with the Securities and Exchange Commission. As of November 30, 2021, FI managed $200 billion, including assets sub-managed for its wholly-owned subsidiaries. FI and its subsidiaries maintain four principal business units - Fisher Investments Institutional Group (FIIG), Fisher Investments Private Client Group (FIPCG), Fisher Investments International (PCGI), and Fisher Investments 401(k) Solutions Group (401(k) Solutions). These groups serve a global client base of diverse investors including corporations, public and multi-employer pension funds, foundations and endowments, insurance companies, healthcare organizations, governments and high-net-worth individuals. FI’s Investment Policy Committee (IPC) is responsible for investment decisions for all investment strategies.
The information in this document constitutes the general views of Fisher Investments and its subsidiaries and should not be regarded as personalized investment advice or a reflection of the performance of Fisher Investments or its clients. We provide our general comments to you based on information we believe to be reliable. There can be no assurances that we will continue to hold this view; and we may change our views at any time based on new information, analysis or reconsideration. Some of the information we have produced for you may have been obtained from a third party source that is not affiliated with Fisher Investments. Investments in securities involves the risk of loss. Past performance is no guarantee of future returns. Data is as of 11/30/2021 and USD unless stated otherwise.
- Top Left Source: FactSet, Fisher Investments Research, as of 12/02/2021. Chart shows the relative performance of the MSCI China to MSCI World on a calendar year basis, 2001-2020. 2021 uses daily returns to 12/02/2021.
- Top Right Source: FactSet, Fisher Investments Research, as of 12/02/2021. Chart shows the relative performance of the MSCI China to MSCI world, daily, indexed to 1 on 12/31/2019 to 12/02/2021.
- Bottom Source: FactSet, USD, 12/31/2019 – 9/30/2021. Based on MSCI China Communication Services and MSCI China Internet & Direct Marketing index. Price level indexed to 1 at 12/31/2019.
To embed this infographic on your website, copy and paste the code below:
See Our Institutional Insights
Stay on top of the latest investment trends and developments with our views and research.
Related Resources
-
Market Analysis Digging Into the Latest Data Out of the Middle Kingdom7/18/2025 12:00:00 AM
-
Expert Commentary This Week in Review | Crypto Week, Q2 2025 Earnings Season, Fed Chair Developments (Jul. 18, 2025)
 7/18/2025 12:00:00 AM
 -
Expert Commentary The Truth About Capitalism
 7/17/2025 12:00:00 AM
 -
Market Analysis The Market Filters News and Noise on Fed ‘Independence’7/17/2025 12:00:00 AM