Personal Wealth Management / In The News
A Clear-Eyed Look at Consumer Credit
Calculated properly, credit card delinquencies didn’t spike.

Every bull market has its own wall of worry, usually a mix of long-running and newfound fears. One of this bull market’s bricks? Consumer debt. Yes, consumer spending is strong, but some worry inflation means that strength is a mirage of tapped savings and credit card irresponsibility, with a side of increasingly stressed auto loans. Such worries hit headlines anew with the New York Fed’s new quarterly snapshot of household debt—and a disproportionate reaction to upticks in credit card debt and delinquencies that included some rather fuzzy math. We see this as a bullish false fear, and now we will show you why.
Step one: Looking at the latest data in historical context. Exhibit 1 does this, plotting credit card and auto loan serious delinquency rates (aka 90+ days delinquent) since 2003—the current origin of the report’s current methodology. Yes, both rose in Q4 2023. Yet both are below their prior highs. Note, too, that those highs came in the aftermath of the 2007 – 2009 recession—they were legacies of prior economic trouble, not the cause of new problems. There was no consumer debt crisis in the early 2010s. Rather, delinquencies fell gradually as the economy grew, lifting incomes and helping household finances improve. To us, this seems like the likeliest scenario now, given healthy GDP and wage growth.
Exhibit 1: Serious Delinquency Rates

Source: New York Fed, as of 2/6/2024. Percent of loan balances 90+ days delinquent, Q1 2003 – Q4 2023.
Last time we covered this topic, we showed debt balances relative to household assets. It will be a few weeks before we can do this with Q4 data since the Fed publishes the denominator at quite a lag. So, stay tuned. But given the uptick in debt balances wasn’t huge, we doubt the picture will have changed much. Headlines made a lot of credit card debt’s 4.6% q/q rise, but that rate is slower than Q3’s and rates seen during 2022.[i] Ditto the 14.5% full-year increase, which was a mite slower than 2022’s 15.2% rise.[ii] As it happens, the year-over-year growth rate seems to have topped out at 17.2% in Q1 2023.[iii] It has slowed every quarter since, a fact even the more sanguine coverage of this report omitted.
Yet the biggest culprit for the debt freakout seems to be math. The New York Fed publishes a table showing “flows into serious delinquency,” meaning the percentage of outstanding loan balances that became 90+ days delinquent in the quarter. The flow of credit card debt into serious delinquency increased from 4.01% in Q4 2022 to 6.36% in Q4 2023.[iv] We encountered multiple articles in high-profile publications calling this a 59% increase because 6.36 is 58.6% higher than 4.01.[v] That 59% rise would be the largest on record.
But here is the trouble: That math is fuzzy, to put it generously. Taking a percent of a percent is a surefire way to overhype a move, and is no-no time, in our view. Seen more clearly, this is not a 59% increase. It is a 2.35 percentage point increase over the past year. As Exhibit 2 shows, once you use this, it is in fact not the largest increase on record—that came in Q2 2009 (Q3 2009 was also a shade higher). That happens to coincide with the end of the 2007 – 2009 recession. Conversely, consider: If you use percent-of-a-percent logic, credit card delinquencies fell by nearly -40% in 2011, a record. We don’t recall anyone writing about Americans’ solvency boom amid post-financial crisis gloom, though.
Exhibit 2: How Not to Lie With Statistics
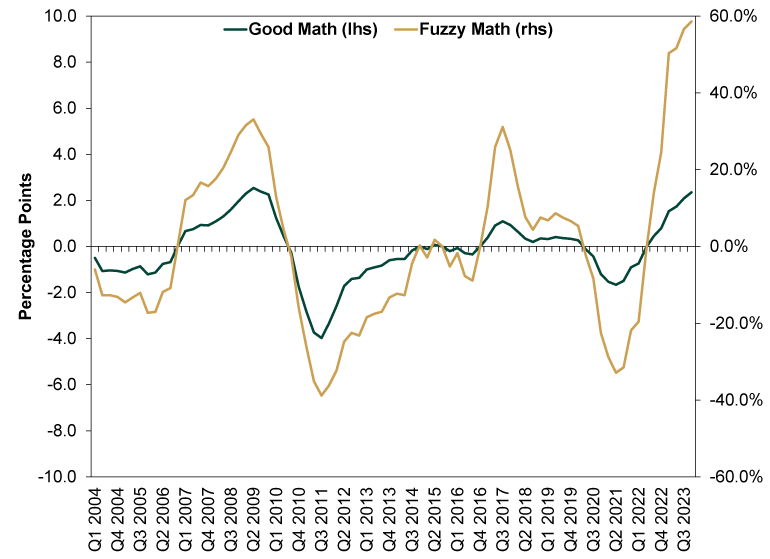
Source: New York Fed, good and fuzzy math, as of 2/6/2024.
But we guess all this does stocks a favor by feeding the fear that keeps expectations low. Stocks move on the gap between those expectations and reality over the foreseeable future, and a false fear built on dodgy calculations widens that gap. So while we may not like the reasons for this false fear’s existence, its sheer existence is a gift to stocks either way. It seems weird to say “enjoy,” but bull market fuel is bull market fuel, and that is what we think this is.
[i] Source: New York Fed, as of 2/6/2024.
[ii] Ibid.
[iii] Ibid.
[iv] Ibid.
[v] “Credit Card Delinquencies Surged in 2023, Indicating ‘Financial Stress,’ New York Fed Says,” Jeff Cox, CNBC, 2/6/2024 and “Americans Owe a Record $1.1 Trillion in Credit Card Debt, Straining Budgets,” Megan Cerullo, CBS News, 2/6/2024.
If you would like to contact the editors responsible for this article, please message MarketMinder directly.
*The content contained in this article represents only the opinions and viewpoints of the Fisher Investments editorial staff.
Get a weekly roundup of our market insights
Sign up for our weekly e-mail newsletter.

You Imagine Your Future. We Help You Get There.
Are you ready to start your journey to a better financial future?

Where Might the Market Go Next?
Confidently tackle the market’s ups and downs with independent research and analysis that tells you where we think stocks are headed—and why.
Related Resources
-
Expert Commentary 3 Things You Need to Know This Week | Q2 Earnings, ECB Meeting, Trump Accounts
 2026-07-20
 -
Weekly Wrap-Up Fisher Investments Reviews: Last Week in Markets—July 13 - July 172026-07-20
-
Market Analysis Pumping Up the Yen?2026-07-17
-
Expert Commentary This Week in Review | US-Iran Conflict, US Inflation, New UK Prime Minister
 2026-07-17


Learn More
Learn why 210,000 clients trust us to manage their money and how Fisher Investments and its affiliates may be able to help you achieve your financial goals.
As of 6/30/2026
New to Fisher? Call Us.
Contact Us Today