Personal Wealth Management / Market Analysis
A Peek at Prior Peaks
A graphical look into market history shows all-time highs don’t predict future market results.

In a recent column, we detailed the arbitrary nature of record market highs—such markers have little value unless you find yourself on the receiving end of Alex Trebek’s glare on Jeopardy under the category “Stock Market Trivia.” (Or, we guess, “Potpourri”—you never know what’ll come up there!)
Since then, the S&P 500 Price Index—the index we discussed specifically—has breached its prior, October 2007 peak. It’s since set several new high-water marks, with some financial media firms touting each successive one as BREAKING NEWS in red font. The reaction to this, broadly, has been fear of heights, a bullish acrophobia indicating we’re not at a typical, euphoria-driven peak of a bull market. Some tie this to long-known, widely discussed fears like the eurozone or contentious politics and presume they’ll zap the bull—though why they’d do so today when they’ve failed to over the better part of the last four years is unaddressed. To us, it seems the folks fearing these old events are simply falling prey to market acrophobia and are justifying this with these chewed-over concerns. The underlying fear, it seems, is the market is just too high. Our point remains, however, that new record highs aren’t predictive of anything.
The twelve charts that follow are a walk through market history. We’ve indexed the peak of each bull market since 1929 to 100, then plotted the ensuing bear and subsequent bull market to its peak. More bull markets exceed their peaks than don’t, by varying margins. They exist (on average) about three years beyond the date the prior peak was exceeded—though this varies greatly and isn’t a forecast (we do not believe in predictions based on mean reversion alone). Rather, there is absolutely no discernible pattern to this—no forward-looking significance to a high water mark whatsoever.
Exhibit 1: 1929 Peak to 1937 Peak
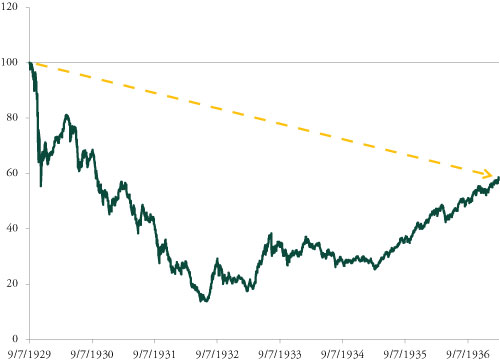
Source: Global Financial Data, Inc. Returns from 9/7/1929 – 3/6/1937. Data accessed 2/15/2013.
Exhibit 2: 1937 Peak to 1946 Peak
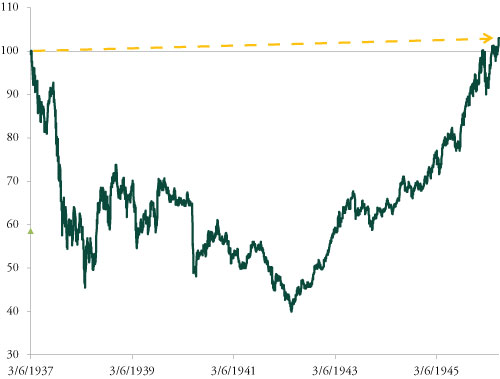
Source: Global Financial Data, Inc. Returns from 3/6/1937 to 5/29/1946. Data accessed 2/15/2013.
Exhibit 3: 1946 Peak to 1956 Peak
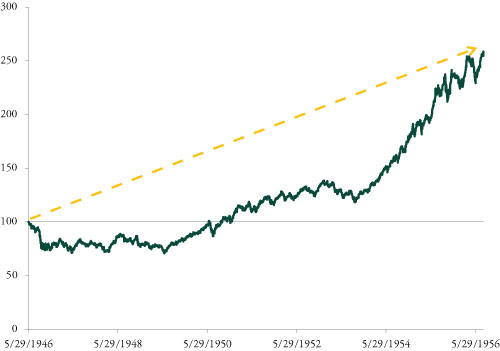
Source: Global Financial Data, Inc. Returns from 5/29/1946 to 8/2/1956. Data accessed 2/15/2013.
Exhibit 4: 1956 Peak to 1961 Peak
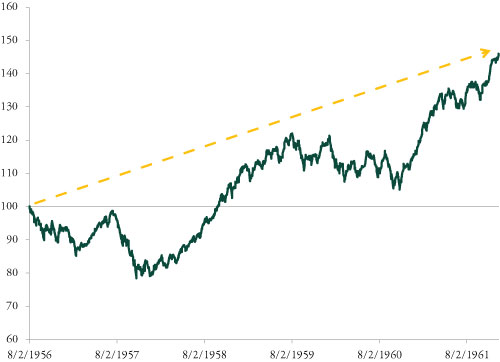
Source: Global Financial Data, Inc. Returns from 8/2/1956 to 12/12/1961. Data accessed 2/15/2013.
Exhibit 5: 1961 Peak to 1966 Peak
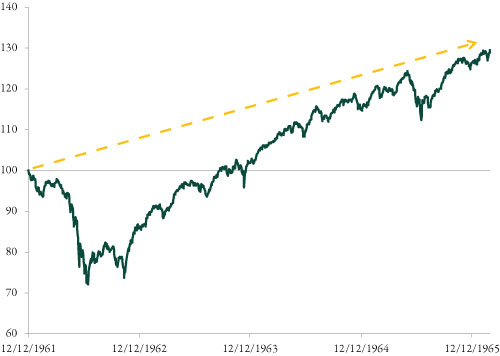
Source: Global Financial Data, Inc. Returns from 12/12/1961 to2/9/1966. Data accessed 2/15/2013.
Exhibit 6: 1966 Peak to 1968 Peak
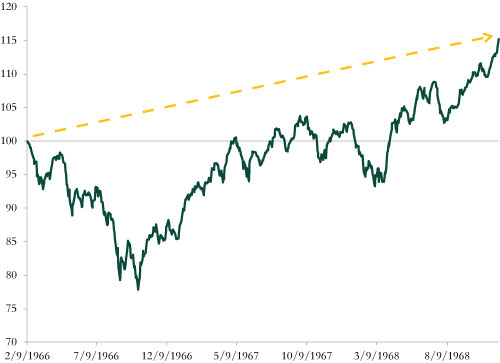
Source: Global Financial Data, Inc. Returns from 2/9/1966 to 11/29/1968. Data accessed 2/15/2013.
Exhibit 7: 1968 Peak to 1973 Peak
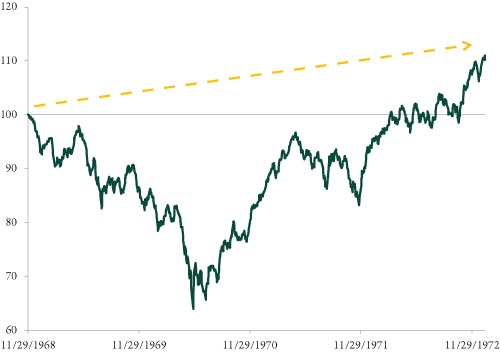
Source: Global Financial Data, Inc. Returns from 11/29/1968 to 1/11/1973. Data accessed 2/15/2013.
Exhibit 8: 1973 Peak to 1980

Source: Global Financial Data, Inc. Returns from 1/11/1973 to 11/28/1980. Data accessed 2/15/2013.
Exhibit 9: 1980 Peak to 1987 Peak
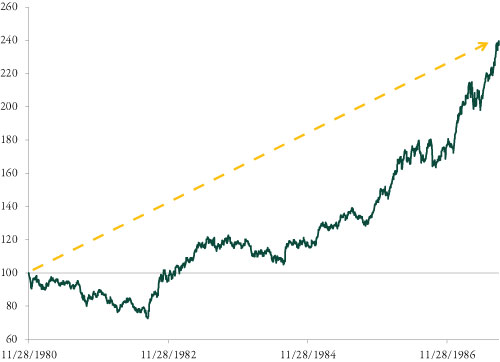
Source: Global Financial Data, Inc. Returns from 11/28/1980 to 8/25/1987. Data accessed 2/15/2013.
Exhibit 10: 1987 Peak to 1990 Peak
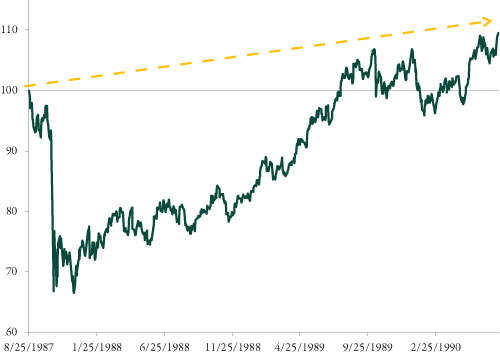
Source: Global Financial Data, Inc. Returns from 8/25/1987 to 7/16/1990. Data accessed 2/15/2013.
Exhibit 11: 1990 Peak to 2000 Peak
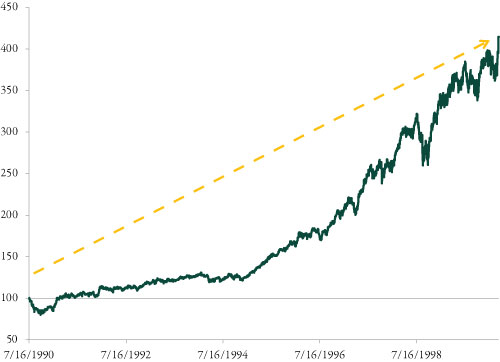
Source: Global Financial Data, Inc. Returns from 7/16/1990 to 3/24/2000. Data accessed 2/15/2013.
Exhibit 12: 2000 Peak to 2007 Peak
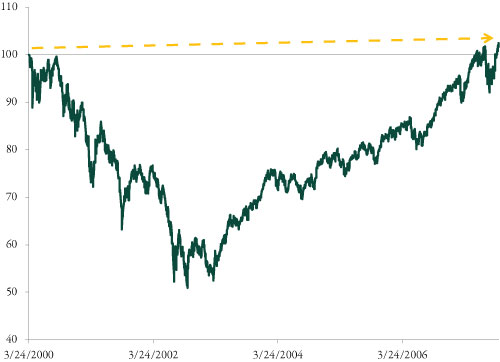
Source: Global Financial Data, Inc. Returns from 3/24/2000 to 10/09/2007. Data accessed 2/15/2013.
If you would like to contact the editors responsible for this article, please message MarketMinder directly.
*The content contained in this article represents only the opinions and viewpoints of the Fisher Investments editorial staff.
Get a weekly roundup of our market insights
Sign up for our weekly e-mail newsletter.

You Imagine Your Future. We Help You Get There.
Are you ready to start your journey to a better financial future?

Where Might the Market Go Next?
Confidently tackle the market’s ups and downs with independent research and analysis that tells you where we think stocks are headed—and why.
Related Resources
-
Politics Beyond the War: A Political Roundup Covering America, Canada and Denmark2026-03-17
-
Economics Doubts Aplenty After UK January GDP Flatlined2026-03-17
-
Economics US Data Stronger Under the Hood Than Many Realize2026-03-16
-
Weekly Wrap-Up Fisher Investments Reviews: Last Week in Markets—March 9 - March 132026-03-16


Learn More
Learn why 195,000 clients trust us to manage their money and how Fisher Investments and its affiliates may be able to help you achieve your financial goals.
As of 12/31/2025
New to Fisher? Call Us.
Contact Us Today