Personal Wealth Management / Market Analysis
A Short Pacific Theater Investment Tour
Disappointing Q3 GDP growth in Australia and Japan highlights their unattractiveness.

While most of the globe is growing at a healthy-if-unspectacular clip, there are virtually always pockets of weakness. Two such weak spots are the Eastern Pacific island nations of Australia and Japan (although technically the former is a continent), which both released disappointing Q3 GDP last week.
Australian GDP shrank -1.9% annualized, below 1.2% consensus expectations. Meanwhile, Japan's growth slipped to a revised 1.3% annualized from its preliminary 2.2% estimate. While Q3 is over and these data are backward-looking, factors under the hood illustrate the unattractive outlook for these two countries. Although they're great vacation spots[i]-exchange rates are favorable for Americans!-neither seem like prime investment opportunities.
Not Such a G'Day Down Under
The fading commodities boom has hit mining-heavy Australia's economy in recent years, and its stocks have followed suit (see Exhibit 1). This isn't to say there has been a recession: Prior to last quarter, Australia grew continually since Q1 2011's Queensland flooding. And, actually, Australia's last recession was in 1991, having sidestepped the global 2008 downturn. We don't expect an Aussie recession now, despite common fears of the Lucky Country's fortunes turning sour.
Exhibit 1: Australian Stocks Track Miners

Source: FactSet, as of 12/13/2016. MSCI Australia Index, MSCI World Materials Index and MSCI World Index indexed to 100 at 12/30/2011.
Australia manufacturing and services purchasing managers' indexes (PMIs) still suggest growth, with readings over 50 in November. The fact poor weather (and its impact on construction) was the contraction's primary culprit means another decline isn't likely, avoiding technical recession. (Keep the streak alive!) Coupled with Aussie stocks' recent outperformance, that might seem reason enough to move more of your portfolio down under, but recency bias is always and everywhere a behavioral error.
Even if Australia stays out of recession, its economy has downshifted. Australia's "core" GDP-stripping out government, inventory changes, exports and imports, and leaving just household consumption and private investment-lacks luster (see Exhibit 2). The five-year average quarterly annualized growth trend for this measure is just 1.2%, and household consumption (57% of GDP) has slowed considerably since 2008. That doesn't mean it will stay slow, but it does suggest the country has some structural weaknesses to overcome. Meanwhile, as Aussie Treasurer Scott Morrison points out: "Driving investment is the challenge. We've had 12 consecutive quarters of contraction in private investment. If you compare this to [the struggles of] 2008 the big difference is business investment."
Slower GDP growth has little connection to stock market performance, but the investment weakness Morrison highlighted happens to be in one of Australia's three biggest equity sectors: Materials. The MSCI Australia Index is heavy on Financials (41%), Materials (15%) and Real Estate (10%), much more than world sector weights of 18%, 5% and 3%. Prior to this year, Materials weakness was a big drag on Aussie relative performance.
Exhibit 2: Australian Core GDP Suggests Positive but Meager Underlying Growth
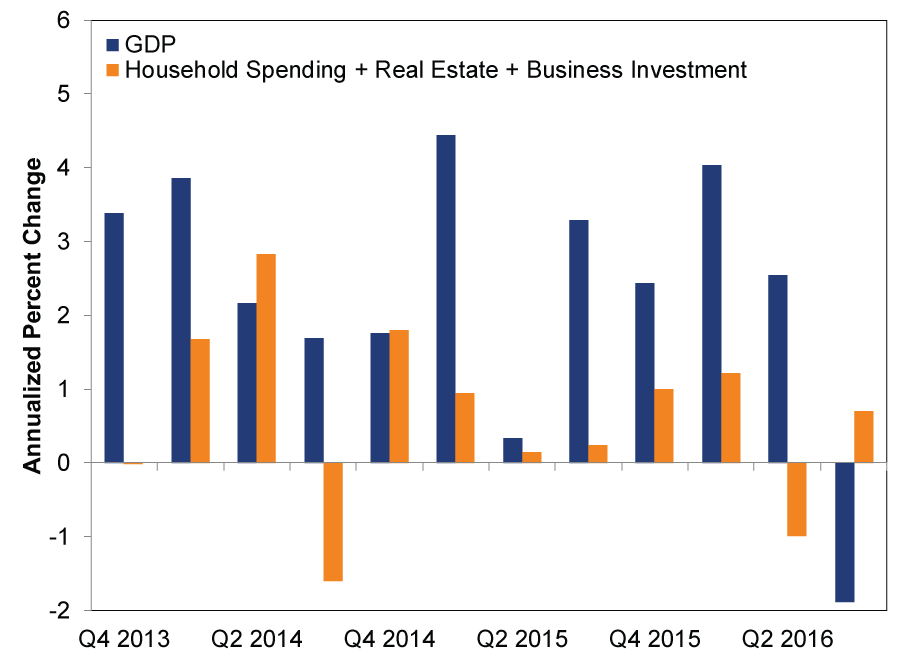
Source: FactSet, as of 12/13/2016.
Materials has done well this year, as iron ore prices have almost doubled, which largely explains Aussie stocks' recent outperformance. But for Materials to rise more, prices would likely need further upside surprise. For a commodity whose surge is "baffling" due to questionable demand drivers, that seems rather speculative. Hence, we question the rally's staying power.
Japan's Sun Still Setting
Japanese equity performance (in yen) since the US election has some claiming the weak yen will lift stocks more. But for US investors, yen-denominated returns are a mirage. In US dollars, recent Japanese returns are far weaker (see Exhibit 3). Underscoring this, Q3's revised GDP shows the economy is about as listless as ever.
Exhibit 3: Japan Underperforms in Dollars
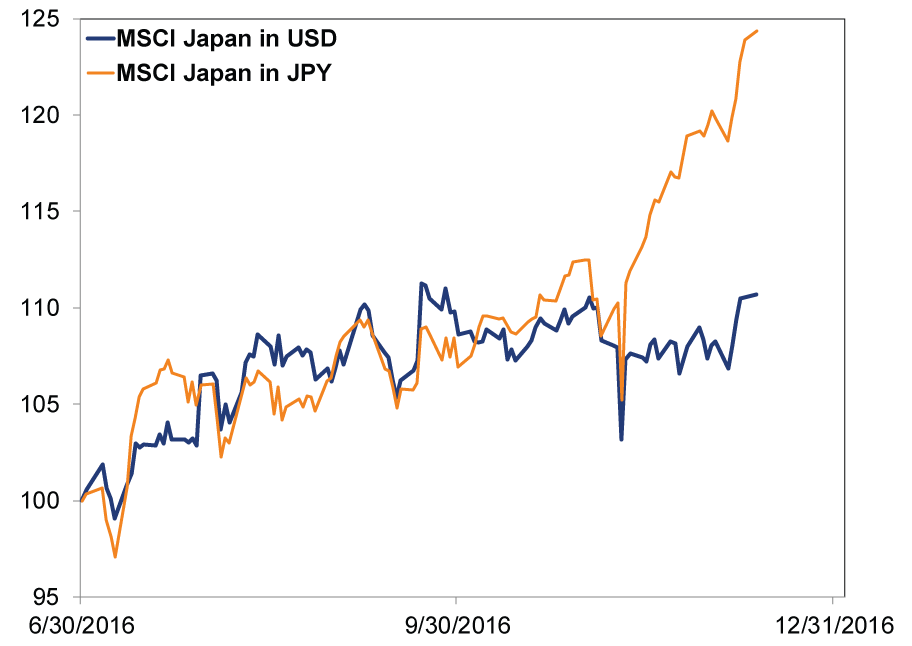
Source: FactSet, St. Louis Federal Reserve and Yahoo Finance! as of 12/13/2016. MSCI Japan indexed to 100 at 06/30/2015.
Private consumption grew just 0.3%, contributing a miniscule 0.1 percentage point (ppt) to the country's 1.3% q/q growth rate. Private capex fell -0.4%. Net trade was the biggest positive contributor, adding 1.7ppts to growth, but only because falling imports inflated the total. In other words, Japan benefited from rising demand overseas, while demand at home sagged. Inventories also subtracted, and have for most of the last year. Considering the long-running weakness in consumption, that suggests businesses' outlook isn't bullish.
Exhibit 4:Japanese Core GDP Suggests Positive but Meager Underlying Growth
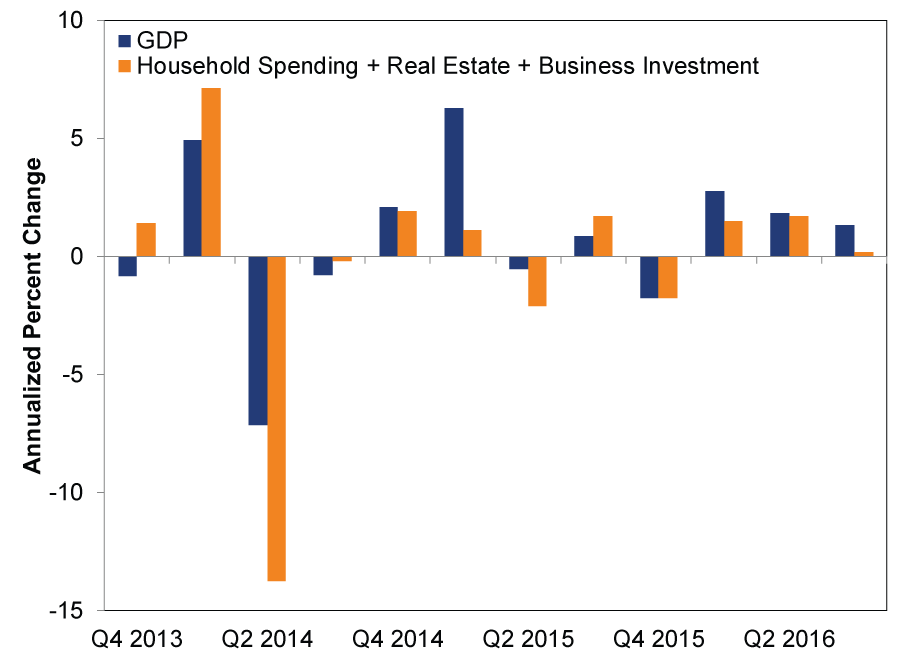
Source: FactSet, as of 12/13/2016.
Additionally, revisions to how Japanese GDP is calculated-increasing the sample size of household consumption data and reclassifying R&D to boost past GDP-while flattering, don't change the fact that it's backward looking or that the economy remains stagnant. Japan's five-year average quarterly annualized "core" GDP growth trend is 0.7% and isn't likely to improve any time soon, absent more open trade and labor markets-ratification of the Trans-Pacific Partnership notwithstanding.
The MSCI Japan Index almost doubles Consumer Discretionary (20%) and Industrials' (20%) weights relative to the World Index's 12% and 11%, respectively. With those sectors barely registering a domestic heartbeat, and most export growth a figment of currency conversions, we continue to expect Japan Inc. to underwhelm.
[i] Travel tip: spend at least two weeks if you're coming from the Western Hemisphere and have the time to get over the jet lag.
If you would like to contact the editors responsible for this article, please message MarketMinder directly.
*The content contained in this article represents only the opinions and viewpoints of the Fisher Investments editorial staff.
Get a weekly roundup of our market insights
Sign up for our weekly e-mail newsletter.

You Imagine Your Future. We Help You Get There.
Are you ready to start your journey to a better financial future?

Where Might the Market Go Next?
Confidently tackle the market’s ups and downs with independent research and analysis that tells you where we think stocks are headed—and why.
Related Resources
-
Market Analysis Pumping Up the Yen?2026-07-17
-
Market Analysis Business Friendly Bureaucracy or No, Britain is Growing2026-07-16
-
Economics Don’t Doubt the Old World2026-07-16
-
Market Analysis On the June Inflation Cooldown2026-07-14


Learn More
Learn why 210,000 clients trust us to manage their money and how Fisher Investments and its affiliates may be able to help you achieve your financial goals.
As of 6/30/2026
New to Fisher? Call Us.
Contact Us Today