Personal Wealth Management / Economics
Beneath US GDP’s Surface-Level Sharp Slowdown, Healthy Growth
US GDP slowed sharply, but a look at components show this is a function of volatility in one volatile component.

Thursday, the US Bureau of Economic Analysis released its advance (first) estimate of US Q3 GDP. The headline figure showed growth slowed sharply to 1.5% from 3.9% in Q2 (seasonally adjusted annual rates).[i] This all comes at a time when many pundits around the world fret slowing growth, so the slowdown may lead one to believe these notions are correct. But, as ever, headline GDP growth rates aren't very telling about real economic conditions on the ground. You must look under the surface and analyze the moving parts. And a look under the surface of US GDP reveals growth is far healthier than the headline figure suggests. GDP is always a bit backward-looking for investors to really rely on, but positively, this headline slowdown doesn't actually support the notion the economy is sharply slowing.
As a primer for the uninitiated, GDP's main contributors are:
- Consumer spending
- Investment (business investment and spending plus residential real estate and inventory change)
- Government spending (state, local and Federal)
- Net exports (exports minus imports)
Sum all those, and you get GDP. So a helpful way to see what's really going on in the report-and to see if this report actually supports the slowdown narrative-is to unpack GDP's components.
To start with the biggest contributor, consumer spending (Personal Consumption Expenditures, in econometric-speak) rose at a 3.2% seasonally adjusted annual rate, only slightly slower than Q2's 3.6% and well ahead of this expansion's average quarterly rate, 2.3%. (Exhibit 1) Since consumer spending is over two-thirds of US GDP, this contributor growing at a 3.2% clip adds 2.19 percentage points to headline growth.
Exhibit 1: Real Personal Consumption Expenditures, Q2 2009 - Q3 2015
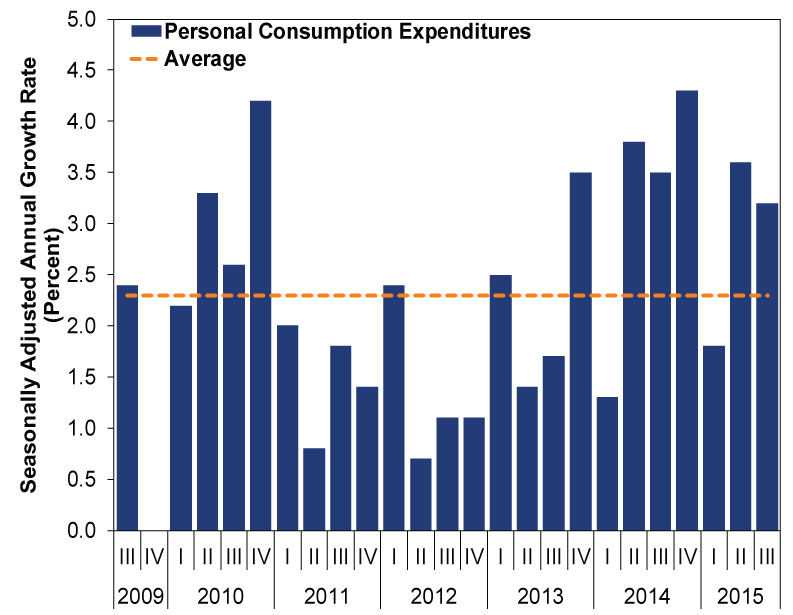
Source: US Bureau of Economic Analysis, as of 10/29/2015.
Fixed Investment, the majority of the investment category that includes business spending and residential real estate, grew 2.9% in Q3. That's down from 5.2% in Q2 and isn't particularly fast, but it is far above the headline growth rate. And it adds 0.47 percentage point to headline growth.
Exhibit 2: Real Fixed Investment (Business Investment Plus Residential Real Estate)
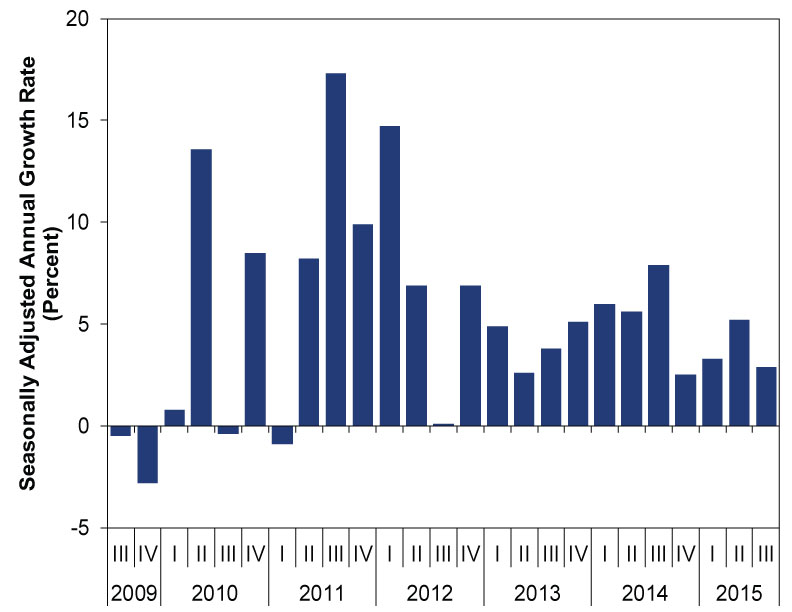
Source: US Bureau of Economic Analysis, as of 10/29/2015.
Exhibit 3: Fixed Investment By Major Category
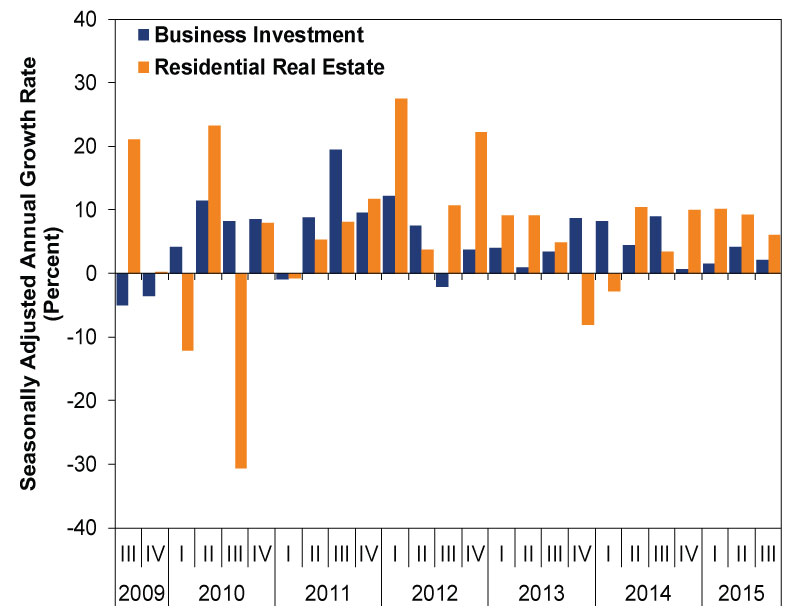
Source: US Bureau of Economic Analysis, as of 10/29/2015.
Government spending, a frequent detractor from US GDP growth in this expansion, didn't detract either. In Q3, total government spending grew 1.7%-only the sixth quarter of positive growth in the (thus far) 25 quarter-long expansion. (Exhibit 4) Government consumption added 0.3 percentage point to growth.
Exhibit 4: Government Consumption
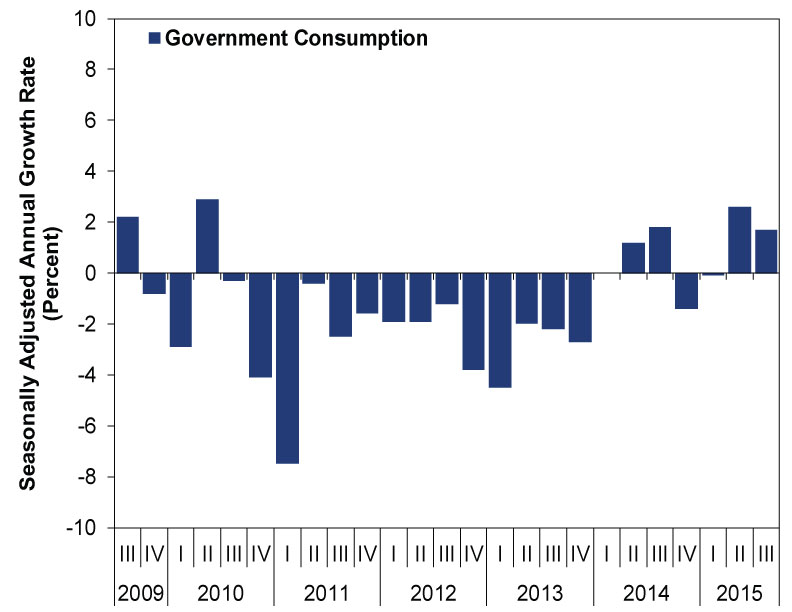
Source: US Bureau of Economic Analysis, as of 10/29/2015.
Now, if you are keeping score of those contributions to headline growth at home, you probably notice that these major categories add up to 3.0% growth-double Q3 2015's headline rate (follow footnote ii for the math).[ii] So what gives?
What gives is inventories. One subcomponent of Investment-inventory change-subtracted -1.44 percentage points from headline growth. You read that right-if this gauge were merely flat, GDP would have grown almost 3.0%. The only other major category to detract was net exports (-0.03 percentage point), which nearly always detracts because GDP counts imports as a negative[iii] and the US imports a lot.
So what does it mean? There are many ways to interpret inventory change data. One could be that falling inventories suggest firms are getting lean as they anticipate a recession, but this would usually be accompanied by other weak data (like flagging consumer spending) and part of a trend. Neither is true here. Another possible explanation is firms previously stockpiled too much, and this move is merely to right size for expected demand. One more? They sold through their stockpiles quickly and didn't replenish fast enough, leading to renewed demand next quarter. Whatever the case may be, we just wouldn't interpret slowing headline GDP-skewed by one extremely volatile subcomponent-to indicate the US economy's health is deteriorating.
[i] Source: US Bureau of Economic Analysis.
[ii] Consumer spending's 2.19 plus fixed investment's 0.47 plus government's 0.30 percentage point equals 2.96 percentage points.
[iii] They aren't a negative for the real economy and if you don't believe us, go ask dockworkers, retailers that sell imported goods, firms that source components and raw materials from abroad and consumers that like to shop based on price.
If you would like to contact the editors responsible for this article, please message MarketMinder directly.
*The content contained in this article represents only the opinions and viewpoints of the Fisher Investments editorial staff.
Get a weekly roundup of our market insights
Sign up for our weekly e-mail newsletter.

You Imagine Your Future. We Help You Get There.
Are you ready to start your journey to a better financial future?

Where Might the Market Go Next?
Confidently tackle the market’s ups and downs with independent research and analysis that tells you where we think stocks are headed—and why.
Related Resources
-
Market Analysis Chart of the Day: Oil’s Substitution Effects, Illustrated2026-06-03
-
Economics Rising Credit Card Delinquencies in Context2026-06-02
-
Market Insights Ken Fisher on Inflation, Sell America, US National Debt and More - June 20262026-06-01
-
Expert Commentary 3 Things You Need to Know This Week | Global PMIs, US Jobs, Estate Planning
 2026-06-01


Learn More
Learn why 200,000 clients trust us to manage their money and how Fisher Investments and its affiliates may be able to help you achieve your financial goals.
As of 3/31/2026
New to Fisher? Call Us.
Contact Us Today