Personal Wealth Management / Economics
Better Than (Widely) Received
Both more granular and broader views of US Q1 GDP growth show Friday’s figures weren’t as bad as received.

+2.2%.
Reported Friday, that was the growth rate of US real GDP in Q1 2012, a result missing analysts’ consensus estimates of 2.5% growth. The figure also marked slowing from Q4 2011’s 3.0% growth, breaking a streak of three consecutive quarters of acceleration.
Media reaction was broad, but most coverage seemingly tilted to the negative—suggesting a decelerating growth rate implies a stalling economy. Or that our recovery remains fragile. To be sure, US headline GDP growth currently is far from the fastest on record. But at the same time, the details suggest Q1’s report was arguably better than Q4’s. Maybe that seems confusing. The explanation largely lies not within headline figures of 2.2% or 3.0%, but within the figure 80%.
When consumer spending’s and exports’ shares are combined, they account for around 80% of US GDP. And in Q1 2012, both accelerated. Consumer spending rose 2.9% in the quarter, the fastest clip since 2010’s Christmas season. Exports grew 5.4%—double their Q4 rate and pushing the series further into record territory. Those factors, taken together, wouldn’t seemingly speak to an economy that stalled in Q1 or has the durability of an eggshell.
So why didn’t headline growth reflect the acceleration of two major inputs? Two primary reasons: Government spent less and GDP’s calculation quirks. In the quarter, total government spending contracted, slashing 60 basis points from growth. Federal government spending reductions accounted for the lion’s share. Aside from government spending cuts, growth was reduced by rising imports (recall, one of GDP’s oddities is imports are considered negative)—which fully offset exports’ positive contribution. Last, a major swing factor the past few quarters—inventory change—didn’t add as much to headline growth as it did in Q4. Though that’s a factor open to a wide array of interpretation itself.
To be sure, other factors wiggled—some positively, some negatively—and the whole report exemplifies the inherent volatility in economic data, a near-universal truth that’s often ignored in the moment. It seems to us in recent years, normal data variability has been frequently met with extrapolation as many project slowing growth forward to imply negativity the data often don’t support. To illustrate the trouble with this, consider the sequential acceleration from Q2 2011 to Q4 2011 didn’t foretell Q1’s deceleration. And perhaps even more significant to investors, while Q1 earnings season has only just begun, early results have been better than expected and shown continued growth thus far.
Our advice remains: Take a longer view and avoid getting too caught up in any one data point. After all, as shown in Exhibit 1, the trend in real GDP since the recession’s end doesn’t allude to many reasons for handwringing. Yes, GDP growth could be quicker. But headline GDP isn’t going to paint a full picture of economic health—and, above all else, growth is growth.
Exhibit 1: Real US GDP (Q1 2007 – Q1 2012)
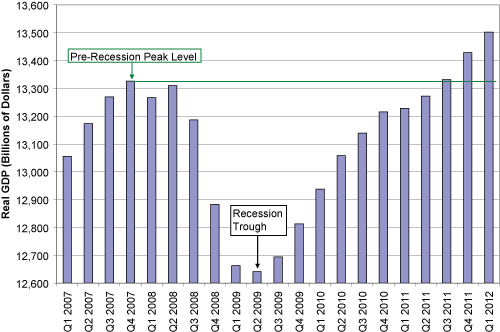
Source: US Bureau of Economic Analysis.
If you would like to contact the editors responsible for this article, please message MarketMinder directly.
*The content contained in this article represents only the opinions and viewpoints of the Fisher Investments editorial staff.
Get a weekly roundup of our market insights
Sign up for our weekly e-mail newsletter.

You Imagine Your Future. We Help You Get There.
Are you ready to start your journey to a better financial future?

Where Might the Market Go Next?
Confidently tackle the market’s ups and downs with independent research and analysis that tells you where we think stocks are headed—and why.
Related Resources
-
Expert Commentary US Inflation, Fed Minutes, Consumer Sentiment | 3 Things You Need to Know This Week
 2026-04-06
 -
Expert Commentary This Week in Review | Q1 Recap, Earnings Guidance, Elections
 2026-04-03
 -
Market Analysis A Forward-Looking Lesson One Year After Liberation Day2026-04-02
-
Market Volatility Some Timeless Counsel After March’s Volatility2026-04-01


Learn More
Learn why 200,000 clients trust us to manage their money and how Fisher Investments and its affiliates may be able to help you achieve your financial goals.
As of 3/31/2026
New to Fisher? Call Us.
Contact Us Today