Personal Wealth Management / Market Analysis
Chart of the Week: Regional Distribution of Fed Lending to Banks
The Fed won’t tell you exactly which banks borrowed, but where they borrowed—and didn’t borrow—is a hint.

Who is next? In the edgy calm since Northern California’s Silicon Valley Bank collapsed and New York’s Signature Bank followed suit, that question is simmering in the background. Oodles of observers assume these two banks must be just the start, with a new 2008-style crisis looming. Some even point to big increases in bank borrowings from the Fed as evidence. But dig deeper, and an interesting picture emerges—one supporting the view the issues here are isolated, not a new nationwide or global calamity building.
Before we go further, some basics about the various Fed tools these data cover are in order, especially the discount window and newly created Bank Term Funding Program (BTFP). The former, the discount window, is perhaps the Federal Reserve’s oldest tool, created to help it serve its original function—acting as the lender of last resort. Through it, solvent banks experiencing liquidity issues can borrow directly from the Fed by posting collateral—loans, corporate bonds or Treasurys, etc.—in exchange for short-term cash. Currently, the discount rate is 5.00%, and a bank can carry the loan for up to 90 days. The BTFP, by contrast, was created by the Powell Fed earlier this month. It similarly lets banks with eligible collateral borrow—but these loans can extend up to one year at fixed rates. In the first two weeks after the two banks failed, increases in Fed lending to banks have been mainly through the discount window, with the BTFP trailing it by some distance. That reversed in the week ended 3/29, as discount window borrowing fell while BTFP borrowing rose. Regardless, banks tapped the two facilities a lot less in this most recent week than in the prior two. Beyond these two facilities, the Fed extended another big slug of credit to the FDIC to help it resolve the two failed institutions. That also cooled dramatically in the week ended Wednesday.
The Fed discloses data on the size of borrowing weekly, but it doesn’t tell you who the borrowers were. Loads of people see those actions in aggregate and presume the roughly $350 billion in increased Fed branch assets indicates a rush in borrowing, arguing it means broad trouble exists. With borrowers’ names and specific actions undisclosed, it feeds the “who is next” murmuring.
But when a bank borrows directly from the Fed, it does so via its regional Fed branch—and the data show the change in assets on the regional banks’ balance sheets. So although Fed data don’t disclose borrowers until well after the loans are drawn, one can form some rough conclusions about how widespread problems are by looking at the weekly change in Fed branch assets. Exhibit 1 does that, showing the three weeks’ data since the two regional US banks failed.
Exhibit 1: Regional Distribution of Change in Weekly Borrowing From the Fed
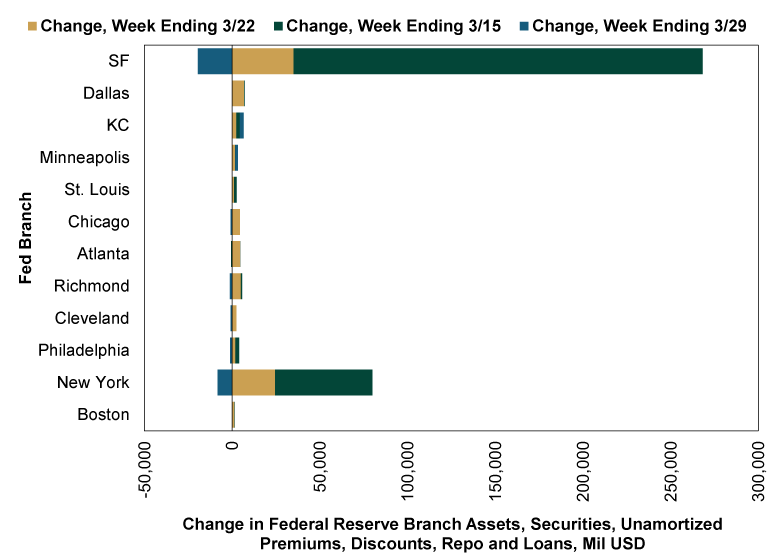
Source: Federal Reserve, as of 3/30/2023. Loan data include lending via discount window, BTFP and loans to the FDIC.
The striking thing about this graph, to us, is the absence of material borrowing outside widely known extensions of credit in New York (Signature) and San Francisco (Silicon Valley Bank and a few other firms that have publicly acknowledged tapping the discount window). In all, it suggests the issues, at least thus far, aren’t nationwide. They are isolated, much like the issues we think plagued the two failing banks. Perhaps that changes, but to us, there is little sign of it now—and little to suggest the calm we see in markets lately precedes a financial storm.
If you would like to contact the editors responsible for this article, please message MarketMinder directly.
*The content contained in this article represents only the opinions and viewpoints of the Fisher Investments editorial staff.
Get a weekly roundup of our market insights
Sign up for our weekly e-mail newsletter.

You Imagine Your Future. We Help You Get There.
Are you ready to start your journey to a better financial future?

Where Might the Market Go Next?
Confidently tackle the market’s ups and downs with independent research and analysis that tells you where we think stocks are headed—and why.
Related Resources
-
Expert Commentary 3 Things You Need to Know This Week | Q2 Earnings, ECB Meeting, Trump Accounts
 2026-07-20
 -
Weekly Wrap-Up Fisher Investments Reviews: Last Week in Markets—July 13 - July 172026-07-20
-
Market Analysis Pumping Up the Yen?2026-07-17
-
Expert Commentary This Week in Review | US-Iran Conflict, US Inflation, New UK Prime Minister
 2026-07-17


Learn More
Learn why 210,000 clients trust us to manage their money and how Fisher Investments and its affiliates may be able to help you achieve your financial goals.
As of 6/30/2026
New to Fisher? Call Us.
Contact Us Today