Personal Wealth Management / Market Analysis
Digging Into a (De)faulty Paradox
Markets pre-priced the corporate default wave.

Lately, many commentators seem transfixed by what they see as a paradox: Corporate bond defaults continue escalating, fulfilling one of investors’ biggest high-rate fears, yet stocks keep hitting all-time highs, corporate bond yields are benign and the economy is growing at a fine clip. But here is the thing: This paradox isn’t actually paradoxical. No, nothing is broken or amiss—this is just markets working pretty much like always.
The global default casualty list isn’t historically big, but the numbers are larger than they have been in a while. Last year saw corporate defaults jump from 85 companies in 2022 to 153, per S&P Global’s latest report, the biggest in seven years aside from 2020’s COVID lockdown madness.[i] Hot on its heels, the year-to-date tally through last week was 29, the most in 15 years (put a pin in this).[ii] Yet corporate bond yields aren’t surging versus similar-maturity Treasurys, stocks are up and the already broader-than-claimed rally is broadening even more. These moves don’t suggest elevated default risk. So what gives?
Simple: Markets look forward, while defaults look backward. When a company can’t meet all its debt service obligations, whether that is paying interest or repaying principal at maturity, that usually doesn’t reflect a single moment in the present. Rather, it is more of a snowball effect from months, if not a year or more, of struggles. Those struggles could include weak revenues, rising costs, trouble getting new financing to bridge the gaps or some combo thereof. These problems usually manifest the most during a recession, which stocks will usually precede with a bear market, making defaults mostly an after-effect of these economic problems.
The discussions of today’s high defaults show this. Again, the year-to-date tally is a 15-year high. What was 15 years ago? January – March 2009, the final heaves of the 2007 – 2009 equity bear market that accompanied the global financial crisis. There was also a deep recession, which ran from the end of 2007 through mid-2009. But the defaults gathered pace late in that process, not early. US corporate bond defaults set a record in 2009, eclipsing the prior high in 2001—which was over a year after the Tech bubble burst and the accompanying bear market began in March 2000.[iii] In both cases, the defaults hit critical mass well after markets registered big problems to come.
And so it went this time. Stocks endured a shallow bear market in 2022, pricing in a multitude of fears—with high rates and their impact featuring prominently alongside inflation, energy prices and a host of others. By that year’s end, it was a foregone conclusion to most that the US would endure a recession in 2023. That didn’t happen, but some industries took a hit, and there were pretty wide-ranging cutbacks as more cash-strapped businesses focused on servicing debt and getting through potentially lean times rather than financing investment. The vast majority of businesses got through it, and we are seeing signs of an investment comeback in a range of measures. But a few hundred couldn’t make it work and defaulted. It all followed the normal course of things, except instead of a recession, the US economy endured an early-year slowdown and pockets of weakness.
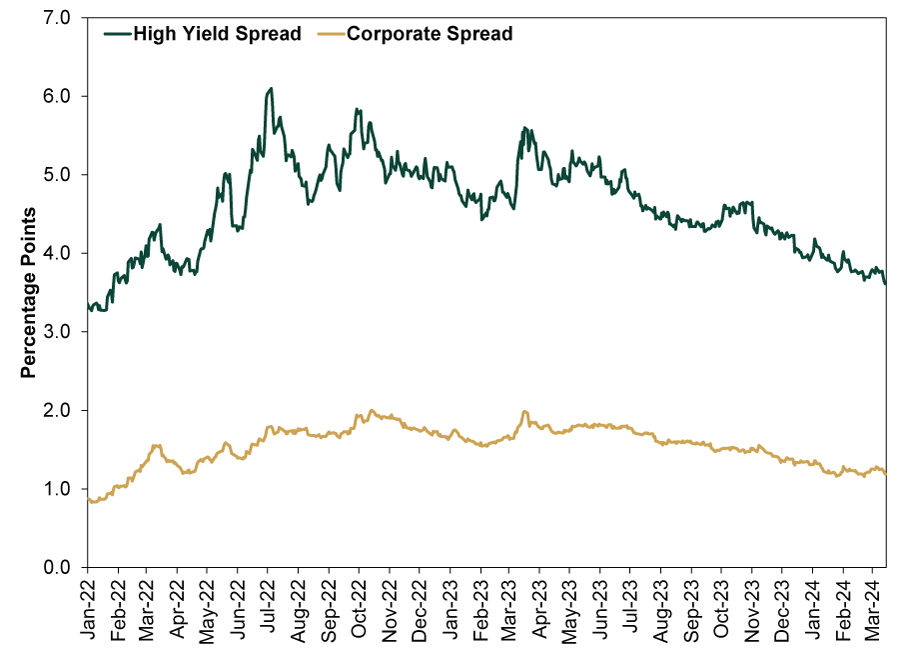
Here is another way to see markets have already dealt with defaults. Exhibit 1 shows credit spreads for US corporate and high-yield bonds versus US Treasurys. When spreads widen, it means investors demand more compensation to lend to businesses, potentially a sign of higher perceived default risk. As you will see, high-yield spreads peaked in July 2022, hit another relative high that October, then had a brief spike a year ago during the freakout over Silicon Valley Bank’s failure. Since then, they have eased quite a bit, falling nearly two percentage points. Broader corporate markets followed a similar, though less volatile, trajectory. Markets pre-priced the default wave and are now looking well beyond it.
Exhibit 1: Credit Spreads Are Easing
Source: FactSet, as of 3/18/2024. ICE BofA US High Yield Index, ICE BofA US Corporate Index and 10-Year US Treasury (Constant Maturity), yield to maturity, 12/31/2021 – 3/15/2024.
[i] “Corporate Debt Defaults Soared 80% in 2023 and Could Be High Again This Year, S&P Says,” Jeff Cox, CNBC, 1/16/2024.
[ii] “Corporate Defaults at Highest Rate Since Global Financial Crisis, Says S&P,” George Steer and Harriet Clarfelt, Financial Times, 3/14/2024.
[iii] “US Corporate Defaults Set a Record in 2009, S&P Says,” Kellie Geressy-Nilsen, The Wall Street Journal, 12/21/2009.
If you would like to contact the editors responsible for this article, please message MarketMinder directly.
*The content contained in this article represents only the opinions and viewpoints of the Fisher Investments editorial staff.
Get a weekly roundup of our market insights
Sign up for our weekly e-mail newsletter.

You Imagine Your Future. We Help You Get There.
Are you ready to start your journey to a better financial future?

Where Might the Market Go Next?
Confidently tackle the market’s ups and downs with independent research and analysis that tells you where we think stocks are headed—and why.
Related Resources
-
Market Analysis Why the SOX “Bear Market” Isn’t Foreboding2026-07-21
-
Politics Blunting Burnham?2026-07-21
-
Expert Commentary 3 Things You Need to Know This Week | Q2 Earnings, ECB Meeting, Trump Accounts
 2026-07-20
 -
Weekly Wrap-Up Fisher Investments Reviews: Last Week in Markets—July 13 - July 172026-07-20


Learn More
Learn why 210,000 clients trust us to manage their money and how Fisher Investments and its affiliates may be able to help you achieve your financial goals.
As of 6/30/2026
New to Fisher? Call Us.
Contact Us Today