Personal Wealth Management / Economics
Few Shocks in Recent Global Economic Data
A roundup of recent global economic data shows few surprises.

From the US Leading Economic Index (LEI) to flash PMIs globally, recent economic data largely show existing trends continuing in early 2024. Here we will round up some of the latest releases and give a quick take on each.
The LEI Flips Positive, Takeaways Still Few and Far Between
First up, the Conference Board’s LEI turned positive in February for the first time since December 2021, ticking up 0.1% m/m.[i] But before you “huzzah” and celebrate, let us consider: This comes after a two-year decline that didn’t presage recession, largely because the LEI overrates manufacturing, around 10% of US GDP by value added.[ii] Perhaps recognizing this extended run of faulty readings, the Conference Board said it didn’t expect recession to result from its gauge last month. Still, the long downtrend caught many investors’ attention, piling onto recession worries.
But now we have an uptick, with 7 of its 10 components contributing. The factors shifting the trend: three manufacturing components (hours worked and two measures of new orders), building permits, jobless claims, the Leading Credit Index (LCI) and stocks. In our view, though, only new orders, the LCI and stocks are forward looking—for the economy, not markets—and manufacturing new orders cover only a small slice of it. Meanwhile, credit conditions have been easing since Q3 2023, based on the Fed’s Senior Loan Officer Opinion Survey on Bank Lending Practices—one of the LCI’s components. That isn’t breaking news, in our view. Furthermore, and beyond the faulty downtrend before, this is just one monthly read: The six-month trend, which the Conference Board looks to as more telling, is still negative. At most, if the LEI keeps rising, we suspect it could help warm sentiment, but that is about it.
Is Housing’s Big Chill Melting?
Elsewhere in America, existing home sales bounced 9.5% y/y in February.[iii] As widely reported, this was as 30-year fixed mortgage rates fell slightly, from over 7% to just under. Sales may be thawing, as people still need to move—inventories rose 10.3% y/y—helping satisfy pent-up demand. But sales levels remain historically low, in the range of 2008’s trough following the housing bust. The difference between now and then: Supply is still tight, with months of supply (how long inventories can last at current sales rates) at 2.9, hovering near record lows. Hence, prices rose another 5.7% y/y.
Contrast that with months’ supply for new homes at 8.4—at the upper end of its historical range.[iv] With elevated mortgage rates continuing to lock up existing home inventories, new home construction has become a bigger driver in meeting housing demand. While it isn’t huge, new construction is the lifeblood of residential investment, the primary way real estate contributes to economic growth.[v] So ongoing bottlenecks in existing home supply, which contributed to prices’ February jump, are a boon for builders—and likely give a small boost to GDP from here. Now, data did show new home sales fell -0.3% m/m in February, but the trend is still up longer term.[vi]
Flash PMIs Are Still Muddling Through
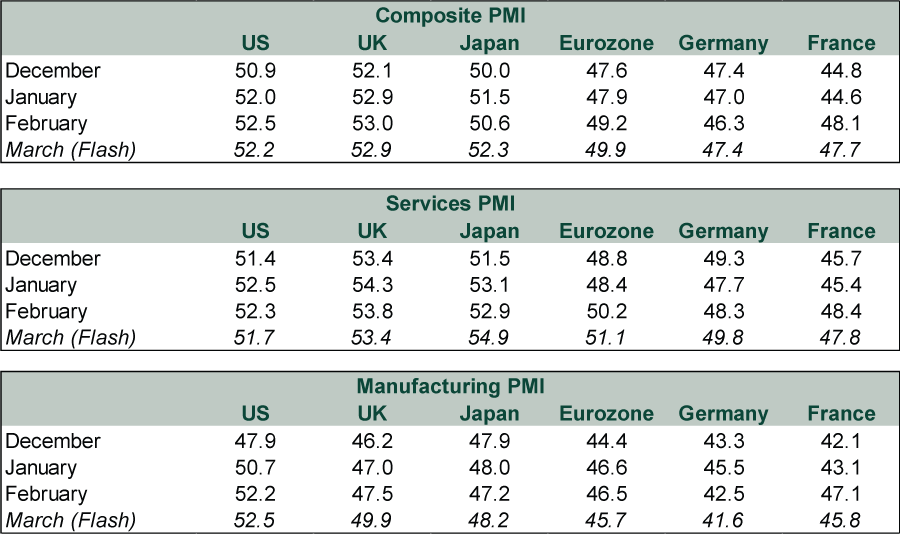
Looking globally, the latest flash purchasing managers’ indexes (PMIs) continue to be mixed. As Exhibit 1 shows, preliminary March PMI readings indicate business activity in the US, UK and Japan expanding overall, led by their services sectors. This contrasts with France and Germany—the eurozone’s two largest economies—where PMIs are below 50 (implying contraction) across the board. However, even with Germany and France still contractionary, the composite PMI for the eurozone as a whole is just a tick below 50, with the Continent’s dominant services sector expansionary for the second straight month. Note, too, that PMIs have been improving before any rate cuts, which we think speaks to the global economy’s resilience—and widespread misperception they are necessary to either avoid recession or extend growth.
Exhibit 1: Major Economy PMIs
Source: FactSet and S&P Global, as of 3/21/2024. Flash PMIs are preliminary estimates based on 85% – 90% of responses.
Japan’s Illusory Export Jump
Japan’s February exports rose 7.8% y/y, beating expectations, though they decelerated from January’s 11.9%.[vii] Headlines touted this as the third straight month of growth with gains in all major trading partners (US, EU, China) and in diverse sectors—autos, semiconductor manufacturing and tourism. But hold on. This is all valued in yen, which has weakened -9.0% over the last year against the dollar, flattering export gains.[viii] On a volume basis, exports fell -1.6% y/y in February, partially reversing the prior two months’ growth. With optimism in Japan rising—due partly to improving headline trade data—this is worth keeping an eye on.
Don’t Overthink Slowing UK Inflation
Lastly, February UK CPI decelerated to 3.4% y/y from 4.0%—its slowest in two and a half years—as inflation continues to subside globally, even in heretofore stubborn areas.[ix] Improvement was broad-based, with even supposedly stickier services inflation falling to 6.1% y/y from 6.5%. This doesn’t seem to be inspiring much cheer, though. While easing prices undercut faster inflation fears, the UK’s National Living Wage is set to rise 9.8% in April, rekindling them.[x] But that isn’t how inflation works, in our view: Wages always follow inflation—they don’t lead or drive it. To us, this fear over a false factor—painting rising wages as negative—shows sentiment is still skeptical, which should help reality top expectations.
Overall, in our view, the last week in data doesn’t reveal much new or surprising information for markets. The existing trends prevailing at yearend mostly seem to remain—and form a benign backdrop for stocks.
[i] Source: The Conference Board, as of 3/21/2024.
[ii] Source: US Bureau of Economic Analysis (BEA), as of 3/22/2024.
[iii] Source: NAR, as of 3/21/2024.
[iv] Source: Federal Reserve Bank of St. Louis, as of 3/25/2024.
[v] Source: BEA, as of 3/22/2024.
[vi] Source: FactSet, as of 3/25/2024.
[vii] Source: FactSet, as of 3/22/2024.
[viii] Ibid.
[ix] Source: ONS, as of 3/20/2024.
[x] Source: GOV.UK, as of 3/22/2024.
If you would like to contact the editors responsible for this article, please message MarketMinder directly.
*The content contained in this article represents only the opinions and viewpoints of the Fisher Investments editorial staff.
Get a weekly roundup of our market insights
Sign up for our weekly e-mail newsletter.

You Imagine Your Future. We Help You Get There.
Are you ready to start your journey to a better financial future?

Where Might the Market Go Next?
Confidently tackle the market’s ups and downs with independent research and analysis that tells you where we think stocks are headed—and why.
Related Resources
-
Economics Quick Hit: Durably Broad-Based Growth2026-07-29
-
Market Analysis On the Chop in the Oil Market2026-07-29
-
Politics Takaichi Raises Japan’s Wall of Worry2026-07-27
-
In The News Why Kevin Warsh should think twice about hiking interest rates — even as anxiety over the Iran war grows2026-07-27


Learn More
Learn why 210,000 clients trust us to manage their money and how Fisher Investments and its affiliates may be able to help you achieve your financial goals.
As of 6/30/2026
New to Fisher? Call Us.
Contact Us Today