Personal Wealth Management / Economics
Nine Charts Illustrate Growth
Recession fears are up lately, but we see little to substantiate them at this point. Here are nine charts to illustrate that.

As stocks zigzagged toward a new correction low this week, headlines featured more and more recession chatter, bemoaning what pundits call disappointing economic data and dreary forecasts. Yet if you slow down, take a step back and look at the data, a different picture emerges—one of a global economy holding up far better than most of this dour commentary suggests. Here is a quick-hitting tour of data illustrating global economic health.
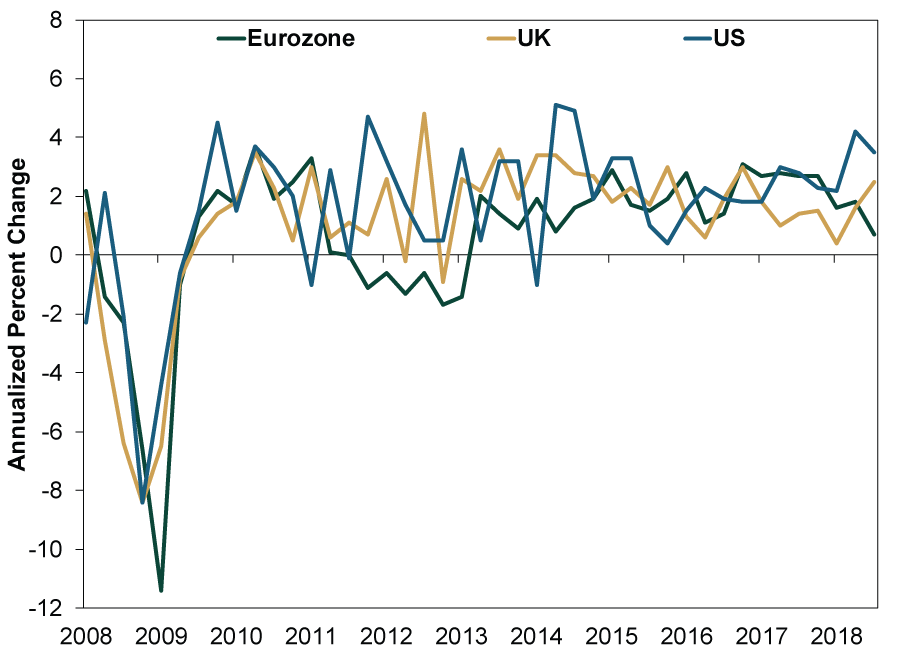
While these data are backward looking, it is worth noting major developed world GDPs entered Q4 growing.
Exhibit 1: GDP Growing Globally
Source: Eurostat and Bureau of Economic Analysis, as of 12/19/2018. Eurozone, UK and US real GDP, Q1 2008 – Q3 2018.
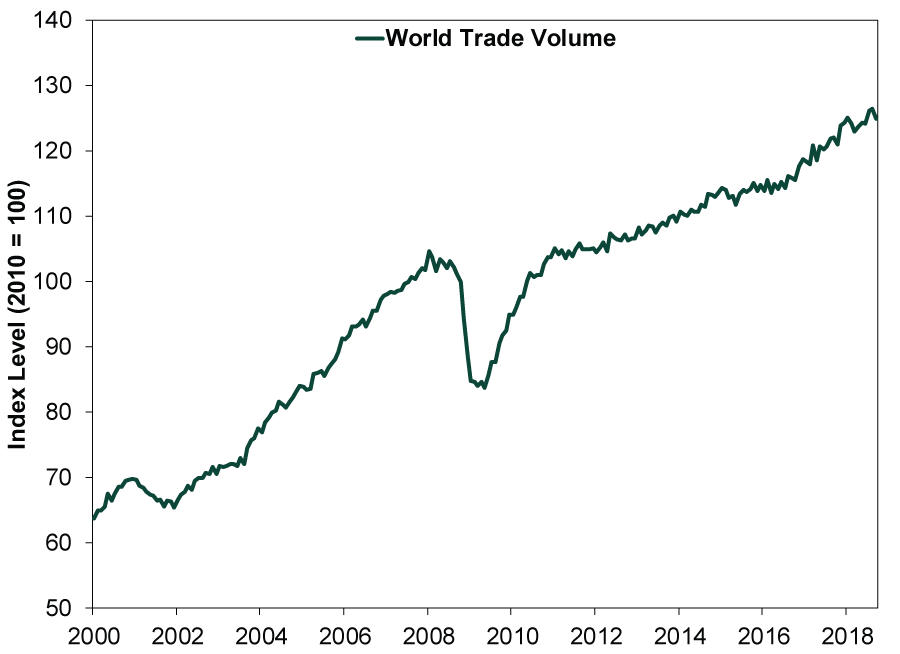
Despite tariff fears, global trade volumes remain in an upward—if choppy—trend.
Exhibit 2: Global Trade Rising
Source: CPB Netherlands Bureau for Economic Policy Analysis, as of 12/17/2018. Merchandise world trade volumes, seasonally adjusted, January 2000 – September 2018.
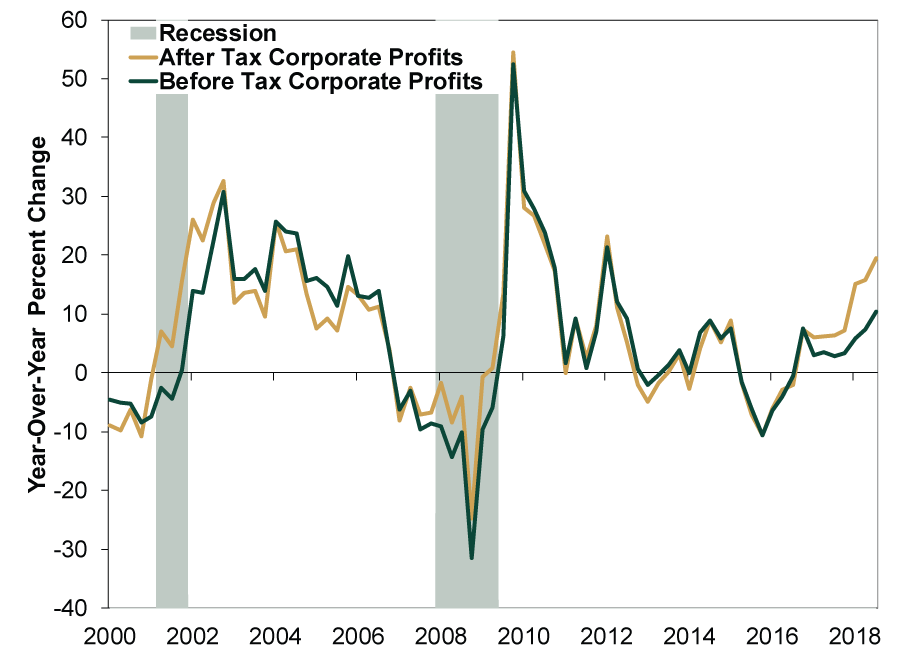
All this global growth is good for business, supporting rising earnings.
Exhibit 3: US Corporate Profits Rising
Source: Federal Reserve Bank of St. Louis, as of 12/19/2018. Before tax and after tax corporate profits with inventory valuation adjustment and capital consumption adjustment, Q1 2000 – Q3 2018.
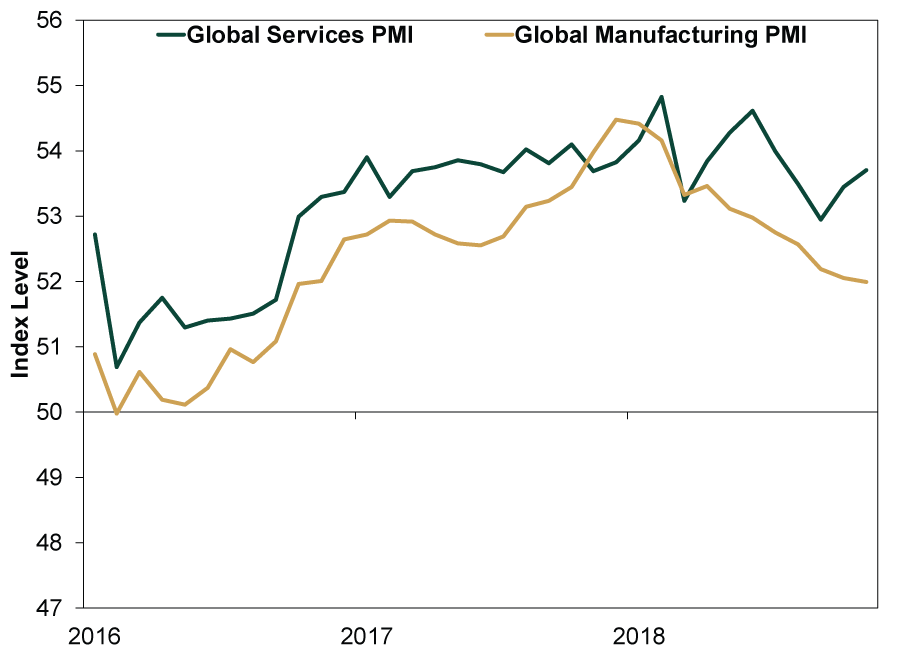
Growth seems healthy thus far in Q4. Global purchasing managers’ indexes (PMIs) remain above 50, indicating continued growth—and positive new orders suggest more ahead.
Exhibit 4: Global PMIs Above 50 and Expanding
Source: FactSet, as of 12/18/2018. JP Morgan Global Services and Manufacturing PMIs, January 2016 – November 2018.
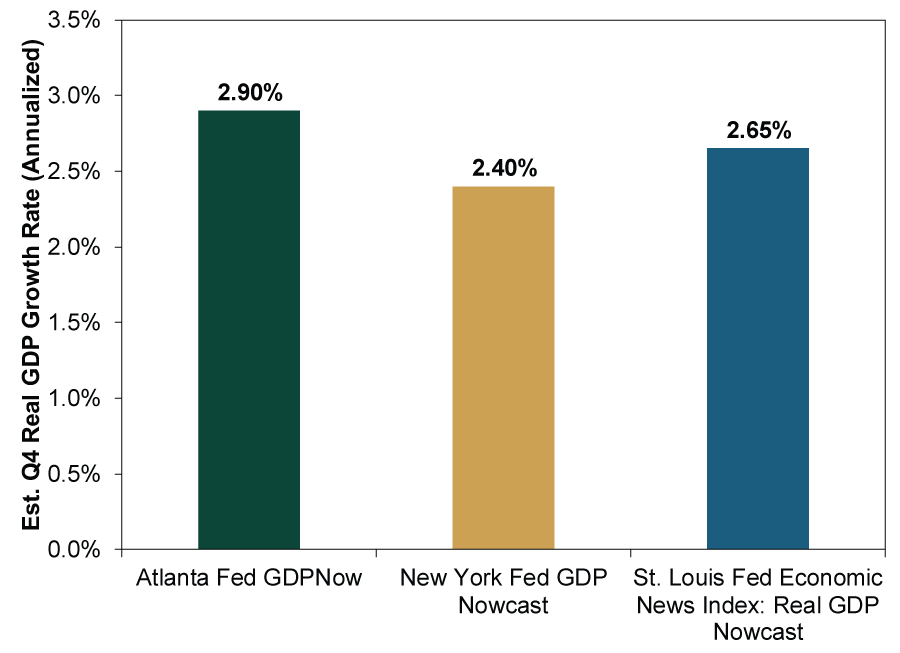
And, while usually not perfectly precise, recent compilations of data releases from the New York, Atlanta and St. Louis Federal Reserve branches—their respective GDP “nowcasts”—point to ongoing US growth in Q4.
Exhibit 5: ‘Nowcasts’ of US Q4 GDP
Source: Federal Reserve Banks of Atlanta, New York and St. Louis, as of 12/19/2018. Q4 GDP estimates shift throughout the quarter with data releases. Each gauge emphasizes different inputs, resulting in three different estimates.
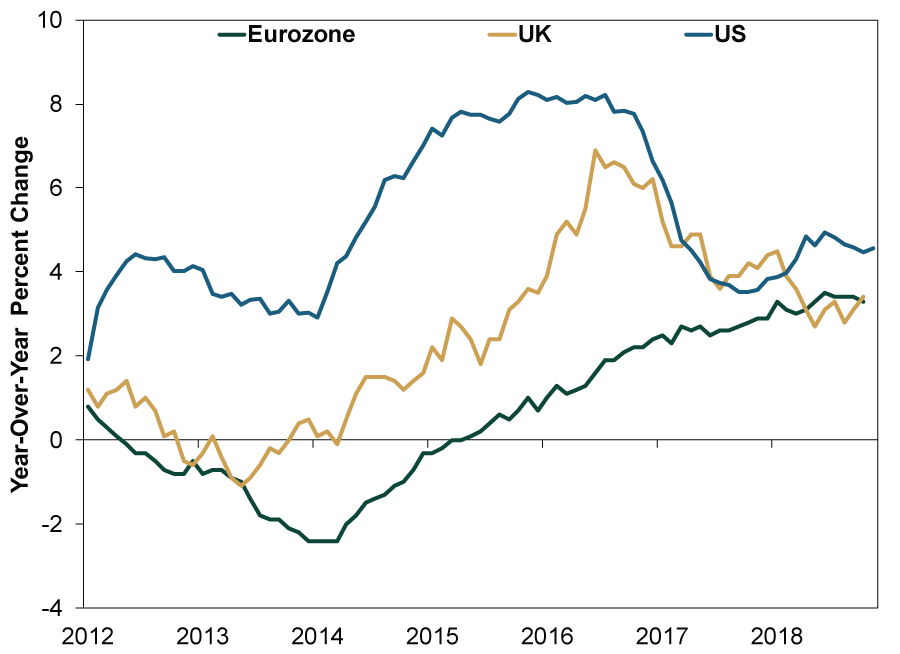
Forward-looking gauges suggest economic growth should continue into 2019. While perhaps not as rapid as in past years, we see steady loan growth in most major regions backing private demand.
Exhibit 6: Private Sector Loan Growth Is Positive
Source: European Central Bank, Bank of England and Federal Reserve, as of 12/17/2018. Non-financial private sector loan growth, January 2012 – October 2018 (November 2018 for US).
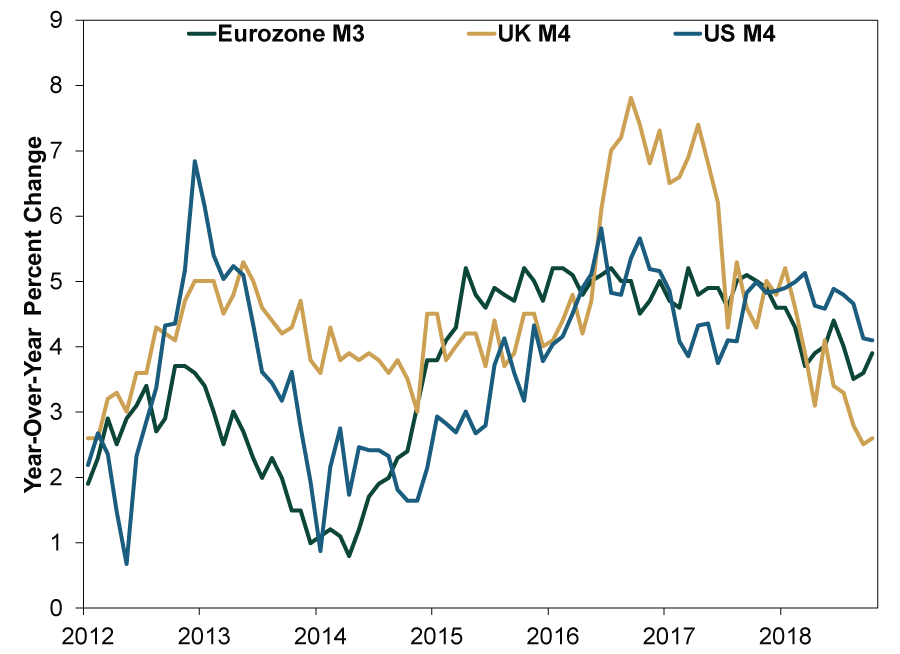
Lending drives money supply, a major influence on future economic growth. Broad money supply measures in major economies show fine growth lately.
Exhibit 7: Broad Money Supply Expanding
Source: European Central Bank, Bank of England and Center for Financial Stability, as of 12/17/2018. Eurozone M3 monetary aggregate, UK M4 excluding intermediate OFCs and US Divisia M4 including Treasuries, January 2012 – October 2018.
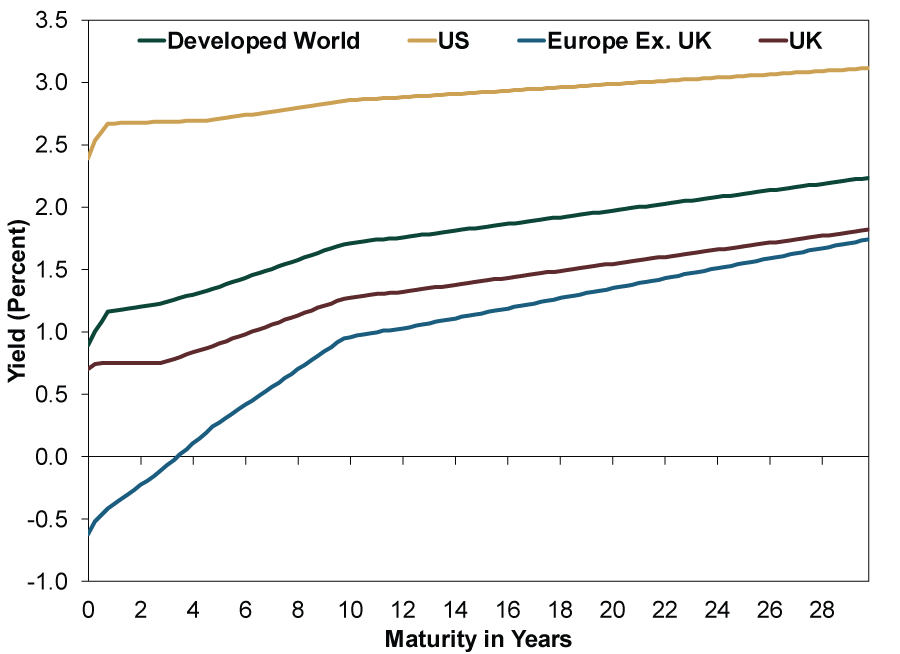
Around the world, yield curves slope upwards, signaling financial conditions fundamentally support the global bull market.
Exhibit 8: Global Yield Curves Slope Upwards
Source: FactSet, as of 12/18/2018. Regional yield curves are weighted by 2017 GDP.
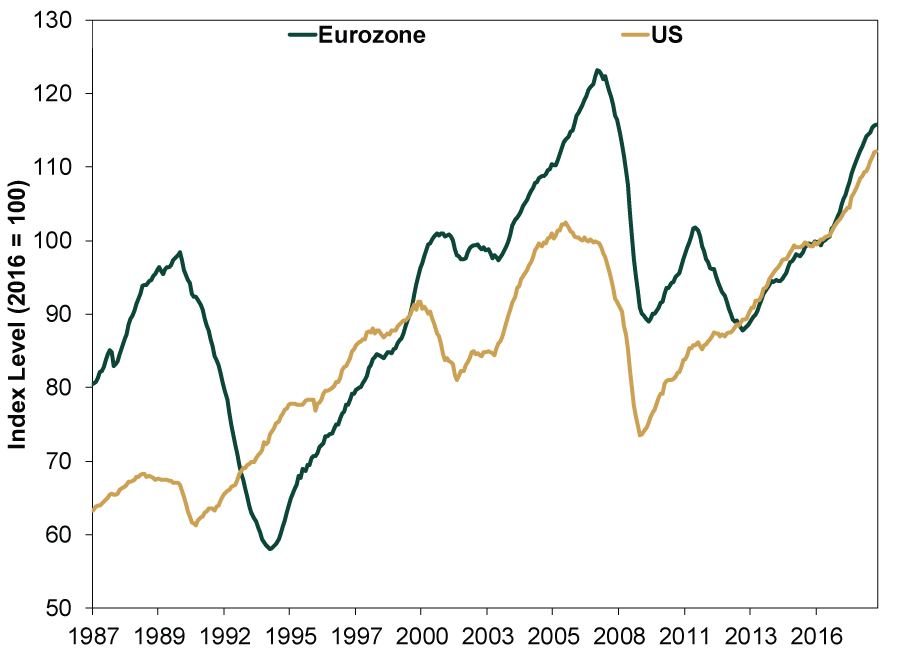
The Conference Board’s latest Leading Economic Index (LEI) releases for the US and eurozone show their long-term upward trends intact—suggesting more growth ahead.
Exhibit 9: US and Eurozone LEIs High and Rising
Source: The Conference Board, as of 12/17/2018. US and Euro Area Leading Economic Indexes, January 1987 – October 2018.
With the global economic outlook solid, the global bull market is on firm footing, in our view. Credit is flowing, business activity is expanding and leading indicators suggest further growth. Stocks move most on the gap between reality and expectations. Given dour correction sentiment is everywhere lately, reality has a low hurdle to positively surprise—why we believe the global bull has farther to run.
If you would like to contact the editors responsible for this article, please message MarketMinder directly.
*The content contained in this article represents only the opinions and viewpoints of the Fisher Investments editorial staff.
Get a weekly roundup of our market insights
Sign up for our weekly e-mail newsletter.

You Imagine Your Future. We Help You Get There.
Are you ready to start your journey to a better financial future?

Where Might the Market Go Next?
Confidently tackle the market’s ups and downs with independent research and analysis that tells you where we think stocks are headed—and why.
Related Resources
-
Market Analysis On the June Inflation Cooldown2026-07-14
-
Expert Commentary 3 Things You Need to Know This Week | US Inflation, China GDP, US Retail Sales
 2026-07-13
 -
Weekly Wrap-Up Fisher Investments Reviews: Last Week in Markets—July 6 - July 102026-07-13
-
Expert Commentary This Week in Review | Global PMIs, SpaceX, RMD Planning
 2026-07-10


Learn More
Learn why 210,000 clients trust us to manage their money and how Fisher Investments and its affiliates may be able to help you achieve your financial goals.
As of 6/30/2026
New to Fisher? Call Us.
Contact Us Today