Personal Wealth Management /
One Fuzzy, Backward-Looking Series to Rule Them All
The Fed's shiny new employment indicator isn't as magical as they make it out to be.

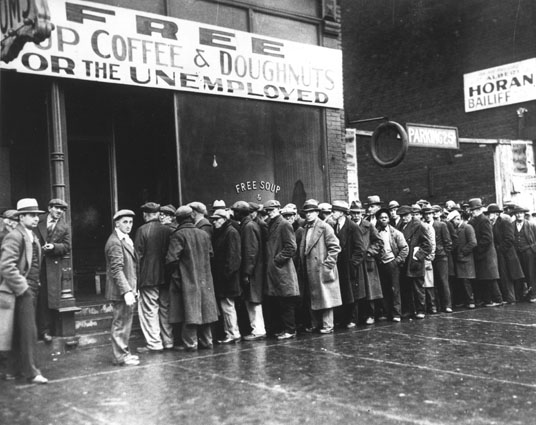
Will a new index help you tell if the unemployment lines are about to get shorter? Photo by PhotoQuest/Getty Images.
2008's financial crisis broke a lot of things. Like bank funding markets. Investor sentiment. Fed forecasting models. Wall Street. Maybe Ben Bernanke for like half a day. A lot of folks are sure it broke something else: labor markets. Particularly the unemployment rate's ability to measure them-from pundits to Fed head Janet Yellen, the consensus seems to be, "It doesn't work anymore!"[i]So thankfully for the world, the Kansas City Fed came to the rescue last week, unveiling its shiny new "Labor Market Conditions Indicators" (LMCI)-24 labor market stats mashed into one. It already has a gold star from Yellen, and its developers claim it has magical labor market forecasting powers.[ii] Please do yourself a favor and do not believe this claim or allow it to impact your views on stocks. Markets look forward, and you can't get much more backward-looking than a composite of 24 backward-looking, late-lagging variables.
The theory behind LMCI is more or less fine. No one stat from any category gives a complete, perfect measure-looking at all available data is a must. The logic behind aggregating variables is sound, too-this is what The Conference Board's Leading Economic Index (LEI) does, and it paints a fairly reliable picture of future activity.
But LEI has predictive power because it uses actual forward-looking economic variables, like the yield curve, credit availability, new orders and stock prices. LMCI lacks predictive power because it includes zero forward-looking variables.
Exhibit 1: LMCI Components
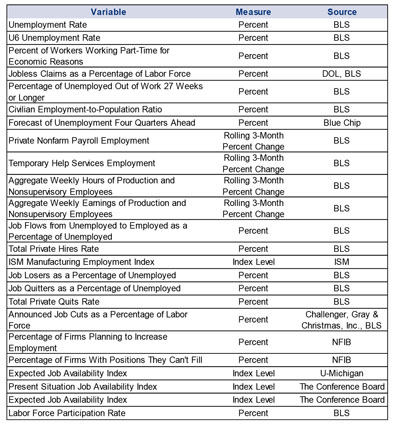
Source: "Background Information for the Kansas City Fed's Labor Market Conditions Indicators," Craig S. Hakkio and Jonathan L. Willis, Federal Reserve Bank of Kansas City, August 27, 2014.
Yes, some appear forward-looking, like "Forecast of Unemployment Four Quarters Ahead," "Firms Planning to Increase Employment" and "Expected Job Availability." But all three are surveys-opinions of economists and business owners. Opinions are not forward-looking indicators.
As for the rest, every single one of those indicators looks backward. Some look super-backward, at rolling-three month changes. The past never predicts the future, and labor markets do not predict labor markets, no matter how you slice and dice them (and LMCI slices and dices them to bits). But we don't need them to! See, the beauty of a late-lagging indicator like the job market is that it, you know, lags something. In this case, labor markets lag the economy. Want to know what's going to happen in job markets several months out? Just look at where the economy is going today. Economic growth foreshadows job trends. Trying to predict a backward-looking indicator with a composite of 24 backward-looking variables is just a tad unnecessary and misguided.
Also, I said earlier the logic behind creating a series is sound, but that doesn't mean LMCI itself is logical or helpful. Consider Yellen's long-running complaint about the unemployment rate: "Estimates of slack necessitate difficult judgments about the magnitudes of the cyclical and structural influences affecting labor market variables, including labor force participation, the extent of part-time employment for economic reasons, and labor market flows, such as the pace of hires and quits." For those who aren't versed in Fedspeak, that means, "unemployment glosses over all these other things." Fair point! But! How would an overly smoothed 24-variable series do anything different? Sure, the Kansas City Fed publishes the top five contributors to both overall activity and the rate of change, but if you're looking that granular, why not just skip the fuss and just go straight to each actual variable? Especially since they're all old news by the time LMCI is published?
All of this would be academic-literally!-were it not for some subtle implications that this index (along with a similar 19-variable composite created by the Fed Board of Governors) will somehow inform monetary policy. As in, when it shows labor markets are back to "normal," they'll know it's ok to tighten interest rates. Um, problem! One, we're talking about a new series that has been back-tested 22 years with incomplete, hypothetical datasets.[iii] Two, that 22-year fuzzy sample is the baseline for "normal." Exhibit 2 shows the full back-tested sample. Zero is considered "average"-right now we're below (but improving, yay).
Exhibit 2: LMCI's Hypothetical History
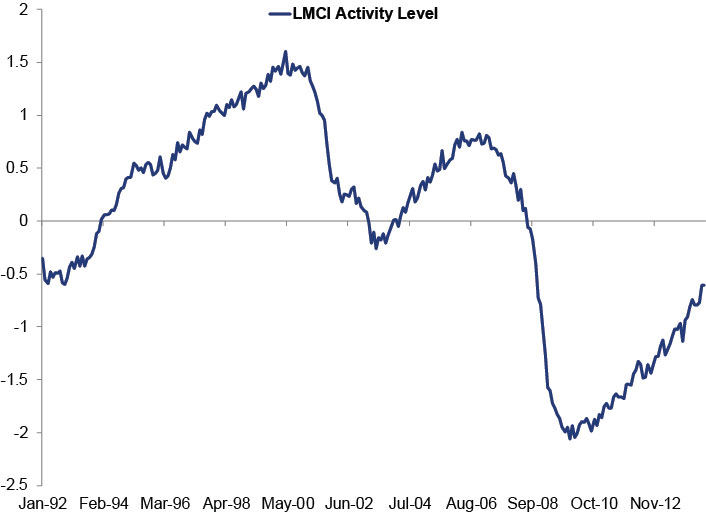
Source: Federal Reserve Bank of Kansas City, as of 08/29/2014
There are more than a few problems here. An average of many extremes over 22 years-a period that includes only one full economic cycle[iv]-isn't telling. And zero is the average today. Zero was not always the average. At the peak of the last expansion in 2007, the average was about 0.5. Nor is zero the average for a full cycle-the chart makes it painfully obvious that 2008 created skew. Maybe that's fair! But you have to wonder, will they keep resetting everything so the average stays at zero? Or are they going to keep everything where it is, have zero be the dividing line between ok and not ok for all of time, and decide that 22 years is a valid baseline? Either way, it's suspect. This makes PMI surveys' use of 50 as a dividing line between growth and contraction look downright logical. At least there, they're basing it on rational inputs-namely, firms' estimates of whether demand and output rose or fell. LMCI's dividing line doesn't even try be anywhere near as telling. It's just an arbitrary thing one can use for comparison maybe.
Today, below-average labor market activity is supposedly justification for keeping interest rates super low because it shows "recent declines in the unemployment rate have overstated improvements in labor market conditions." Which is a long-running Yellen viewpoint and kind of sort of makes one wonder if there wasn't some deliberate data-mining here-you know, beating the data into submission until they proved the desired point. Especially because there are some interesting omissions from the series, like ADP's estimates of private sector employment. And the BLS's measure of "discouraged" workers. One has to wonder: Did they make LMCI a little less convenient?
But conspiracy theory isn't what matters for investors. Here's what's important: Just because the Fed has a handy new labor market measuring stick doesn't mean monetary policy is about to get permanently perfect. It's an imperfect measuring stick. And the Fed has long since proven they'll go off script whenever they feel like it-which means you can't use LMCI to game their next move. They'll be the same human, arbitrary, unpredictable central bank they've always been.[v] They'll just do it with one more stat to toss out in press releases.
[i] On the one hand, you almost have to tip your hat to them for realizing the unemployment rate is a quite limited indicator of the job market. But, this isn't exactly breaking news. It has been fuzzy and myopic since about always.
[ii] Ok so they don't actually say magical. But I like to think that's just because the word "magical" would be out of place in an academic paper on econometrics. There, you have to say things like, "we regress the change in the level of activity indicator on the momentum indicator using the entire sample. Assuming momentum in the future equals its average value over the last 12 months, we can predict future values of the activity index. A second method simply extrapolates the trend in the activity index we have observed over the last 12 months. Both methods suggest that the activity index will return to its historical average in the second half of 2015." See? Past-data-extrapolating, straight-line-mathing, mean-reversion magic! (Also about as real as Merlin and Harry Potter.)
[iii] The footnotes in the "Background Information" document explain everything, but in short, some of the datasets don't go back to 1992, so they were manually and hypothetically reconstructed. Oh, and moving forward, because the BLS's "Job Openings and Labor Turnover" survey (aka JOLT) usually comes out a month after everything else, they're going to use an estimate, based on a mathematic model using the past few months' results.
[iv] I'm defining cycle as full expansion and recession, starting with the up and ending with the down. The 1990s expansion was well underway by January 1992, and the current expansion is still going. So there is really only one full trough-to-peak-to-trough cycle here. And parts of two others.
If you would like to contact the editors responsible for this article, please message MarketMinder directly.
*The content contained in this article represents only the opinions and viewpoints of the Fisher Investments editorial staff.
Get a weekly roundup of our market insights
Sign up for our weekly e-mail newsletter.

You Imagine Your Future. We Help You Get There.
Are you ready to start your journey to a better financial future?

Where Might the Market Go Next?
Confidently tackle the market’s ups and downs with independent research and analysis that tells you where we think stocks are headed—and why.
Related Resources
-
Market Analysis Why “War Winner” Trades Are Off Base2026-03-20
-
Expert Commentary This Week in Review | Energy Markets, Fed Meeting, Earnings Reporting
 2026-03-20
 -
Market Analysis Around the World in Central Banking, Iran War Edition2026-03-19
-
Politics Beyond the War: A Political Roundup Covering America, Canada and Denmark2026-03-17


Learn More
Learn why 195,000 clients trust us to manage their money and how Fisher Investments and its affiliates may be able to help you achieve your financial goals.
As of 12/31/2025
New to Fisher? Call Us.
Contact Us Today