Personal Wealth Management / Market Analysis
The Early Deposit and Loan Data Post-Silicon Valley Bank Are In
And they show banks didn’t get suddenly risk-averse.

Since Silicon Valley Bank (SIVB) failed just over two weeks ago, investors have had one big question: Would its crisis ripple through the entire banking system—and, in particular, small regional banks? Would the bank run spread? Would credit freeze? We now have a bit of data to shed some light on this, courtesy of the Fed’s weekly H.8 report, “Assets and Liabilities of Commercial Banks in the United States.” Released every Friday, it reports weekly changes in bank balance sheet line items as of Wednesday the prior week. On Friday we got data for the week ending March 15, which includes SIVB’s and Signature Bank’s failures. We won’t bore you with these data every time they come out, but at least on this occasion, we think it is noteworthy that deposits shifted somewhat but didn’t tank—and banks didn’t deleverage.
Coverage of this report notes that deposits fell by the most in nearly a year, while separate data showed money market fund inflows up over the same period. The implication: People are yanking deposits over the FDIC’s $250,000 insurance limit and placing them in higher-yielding money market funds. We don’t think the headline stats tell the full story, however. The neat thing about H.8 is that it breaks the data down by small domestically chartered banks, large domestically chartered banks and “foreign-related” institutions. Exhibit 1 shows the weekly change in deposits at all three—and overall—on a seasonally adjusted and non-seasonally adjusted basis. As you will see, some deposits left the system—and some moved within it.
Exhibit 1: Change in Bank Deposits in the Week Ending March 15, 2023
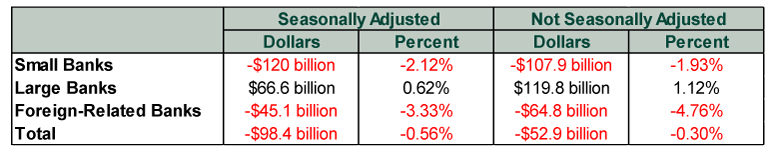
Source: Federal Reserve, as of 3/24/2023. All changes are week-over-week. May not sum due to rounding.
We think it is fair to presume the drop in foreign-related banks’ deposits is a manifestation of Credit Suisse fears, which were in full swing last week. As for the other, it seems some of the flight from small banks went to large ones, which is consistent with anecdotal reports of the “systemically important” institutions taking market share, and some went to money market funds. Overall, nothing terribly surprising, but the numbers involved don’t seem huge to us. Small banks still finished the week with just under $5.5 trillion in deposits. That is pretty flush, and losing just 2.1% of deposits is pretty well short of a systemic run.
Perhaps more importantly: Banks aren’t deleveraging. Separate Fed data covering this same period show banks tapping both the discount window and the new Bank Term Funding Program, which lets regional banks pledge high-quality assets as collateral at par value to secure short-term Fed funding. The names of banks who used these facilities won’t be public for years, but the amount borrowed ($148 billion from the discount window and $12 billion from the BTFP) exceeds the amount of lost deposits, suggesting banks are building liquidity buffers.[i] But this liquidity is helping support higher lending, even among smaller banks. Witness Exhibit 2.
Exhibit 2: Change in Bank Lending in the Week Ending March 15, 2023
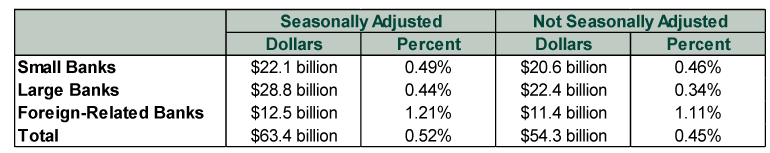
Source: Federal Reserve, as of 3/24/2023. All changes are week-over-week. May not sum due to rounding.
Year-over-year loan growth rates also remain strong: 10.8% y/y for all banks—up from 10.4% a week prior—14.6% for small and 7.5% for large banks.[ii] So from all angles, in the first week of the presumed US regional banking crisis at least, banks haven’t decided a dollar saved is better than a dollar lent. Not even small banks. Perhaps that changes with time or as regulatory chatter grows. Or perhaps it doesn’t. Perhaps a few weeks’ more data shore up confidence that the system really is pretty sound and SIVB and Signature’s business models were outliers in the industry, reducing uncertainty and enabling everyone to move on.
If you would like to contact the editors responsible for this article, please message MarketMinder directly.
*The content contained in this article represents only the opinions and viewpoints of the Fisher Investments editorial staff.
Get a weekly roundup of our market insights
Sign up for our weekly e-mail newsletter.

You Imagine Your Future. We Help You Get There.
Are you ready to start your journey to a better financial future?

Where Might the Market Go Next?
Confidently tackle the market’s ups and downs with independent research and analysis that tells you where we think stocks are headed—and why.
Related Resources
-
In The News Why Kevin Warsh should think twice about hiking interest rates — even as anxiety over the Iran war grows2026-07-27
-
Expert Commentary This Week in Review | Market Volatility, Tariffs, SpaceX
 2026-07-24
 -
Market Analysis The New Tariffs in Town Are Still Old News2026-07-24
-
Economics A Summertime Check-in on US Consumers2026-07-23


Learn More
Learn why 210,000 clients trust us to manage their money and how Fisher Investments and its affiliates may be able to help you achieve your financial goals.
As of 6/30/2026
New to Fisher? Call Us.
Contact Us Today