Personal Wealth Management / Market Analysis
The Shocking Truth About Today’s P/E Ratios
P/Es don’t fit the narrative of a wildly overpriced stock market.

Have you heard the one about stocks being really expensive? We sure have, with most of the chatter centering on the S&P 500’s above-average price-to-earnings (P/E) ratio. Some pundits argue this sets up a weak 2022. The Fed got in on the action this week, warning in its semiannual Financial Stability Report that high valuations make stocks “vulnerable to significant declines should investor risk sentiment deteriorate, progress on containing the virus disappoint, or the economic recovery stall.”[i] While the Fed’s analysis was measured, some pundits took the headline and ran, taking it on faith that surging valuations pose a risk. So it might interest you to know that valuations are, well, down over the past year-plus. Mind you, we don’t think valuations are predictive, but we think this is a shining example of pundits ignoring the denominator—earnings—and drawing off-base conclusions as a result.
Exhibit 1 shows the S&P 500’s trailing P/E—that is, price divided by the past 12 months’ earnings—since the end of 2018. In our view, this metric is inherently backward-looking, as stocks move on expectations for profits and fundamentals over the next 3 – 30 months. Markets today are pricing in next year’s profitability, not last year’s. Yet trailing P/Es are oft cited as evidence of stocks’ being overvalued, so let us take a look.
Exhibit 1: Checking In on Trailing P/Es
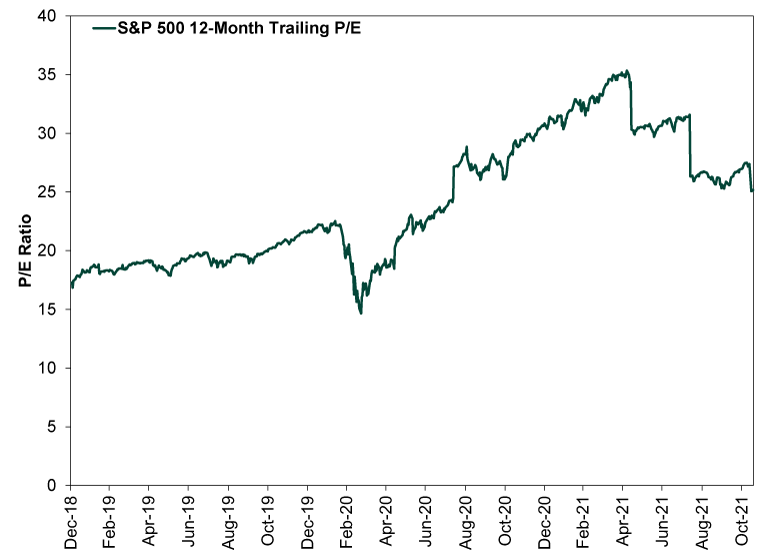
Source: FactSet, as of 11/19/2021.
Errr … some surge. Yes, P/Es exceed pre-pandemic levels, but they are down by over 10 percentage points since peaking on May 7—even though the S&P 500 is up 12.0% since then through yesterday’s (record-high) close.[ii] The reason for this is quite simple: The E improved relatively faster than the P over the past six months. Earnings tanked last year as lockdowns took their toll, which inflated valuations as stocks recovered—a natural byproduct of stocks moving ahead of earnings, which is normal. But they bounced high this year, as reopening fueled sky-high growth from a lockdown-depressed base. Look closely at the chart, and you will see three vertical drops in mid-May, mid-August and mid-November, all coinciding with earnings season coming in hot. So when it came to P/Es, as the denominator (earnings) grew faster than the numerator (price), the ratio dropped. Given all of this backward-looking pandemic skew, we think it is fruitless to draw any big conclusions—good or bad.
Forward P/Es, which compare stocks’ prices to expected earnings over the next year, show a similar—if more muted—trend. As Exhibit 2 shows, the S&P 500’s forward P/E peaked on September 2, 2020. It is down from 23.4 then to 21.4 as of yesterday’s close, despite the S&P 500’s 33.8% total return over this span.[iii]
Exhibit 2: Checking In on Forward P/Es
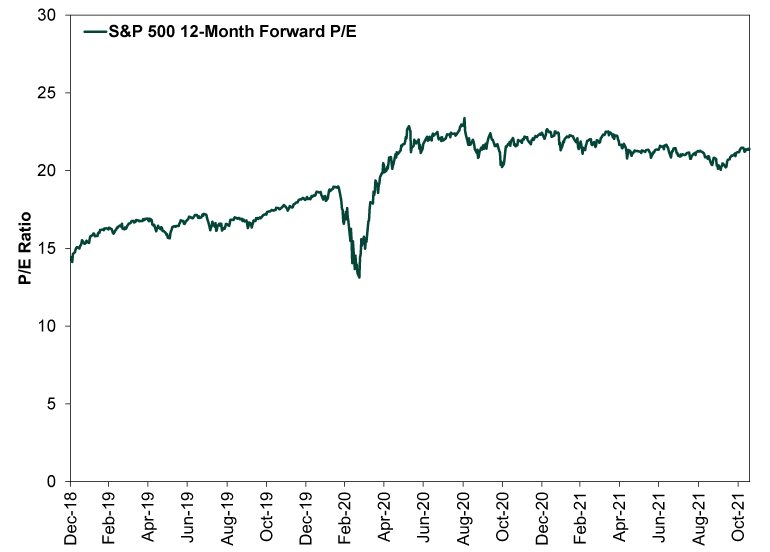
Source: FactSet, as of 11/19/2021.
You can thank earnings for falling forward P/Es, too. As it became clear that sentiment overshot to the downside late last summer, analysts started raising their earnings outlooks. That trend has continued this year as earnings have smashed expectations. So even as investors have bid stock prices higher, they are actually paying a bit less for expected future earnings growth than they were over a year ago.
While we don’t think P/Es are predictive, we do think this is telling from a sentiment standpoint, as P/Es can indicate expectations getting out of hand. Not the level of P/Es, but the rate of change. A big spike could be one indication of euphoria and has often preceded bull market peaks. The past 14-plus months’ slow drift lower is, well, not a spike. So in our view, this is one indication sentiment has room to run and stocks have more wall of worry to climb.
We also think this serves as a friendly reminder about how stocks and valuations work. Pundits often talk about “expensive” and “cheap” markets as if high P/Es predict weak gains and low P/Es predict big ones. But that focuses on price only, ignoring earnings. It also ignores that pricey stocks can get pricier and cheap markets can get cheaper. There are no magic thresholds or signals in P/Es. So take them for what they are: a loose sentiment gauge that doesn’t automatically tell you what will happen next week, next month or next year.
If you would like to contact the editors responsible for this article, please message MarketMinder directly.
*The content contained in this article represents only the opinions and viewpoints of the Fisher Investments editorial staff.
Get a weekly roundup of our market insights
Sign up for our weekly e-mail newsletter.
See Our Investment Guides
The world of investing can seem like a giant maze. Fisher Investments has developed several informational and educational guides tackling a variety of investing topics.
Related Resources
-
Market Analysis Digging Into the Latest Data Out of the Middle Kingdom7/18/2025 12:00:00 AM
-
Expert Commentary This Week in Review | Crypto Week, Q2 2025 Earnings Season, Fed Chair Developments (Jul. 18, 2025)
 7/18/2025 12:00:00 AM
 -
Expert Commentary The Truth About Capitalism
 7/17/2025 12:00:00 AM
 -
Market Analysis The Market Filters News and Noise on Fed ‘Independence’7/17/2025 12:00:00 AM


Learn More
Learn why 185,000 clients* trust us to manage their money and how we may be able to help you achieve your financial goals.
*As of 6/30/2025
New to Fisher? Call Us.
Contact Us Today