Personal Wealth Management / Economics
A Dose of (Mostly) Growthy Data
Most recent economic data run counter to widespread global recession fears.

Amid the sound and fury of market volatility and global recession fears, something is strangely absent: meaningful economic data supporting these fears. It has been a fairly slow two weeks for economic releases, which have included plenty of good news. Most releases underscore the long-running trend of moderate global growth, with strong countries outweighing pockets of weakness. Meanwhile, forward-looking indicators suggest the global expansion remains alive and well. This is some pretty compelling evidence this decline is sentiment-driven, a classic correction. Sentiment can rock stocks in the short term, but over longer stretches stocks weigh fundamentals. With plenty of positive fundamentals to weigh, we think the bull market likely has further room to run.
Here is a list of every meaningful data point from major countries year to date. The data is sorted by region and then by date within each country. You'll see some good, some not so good, some big metrics (GDP) and small ones (Japanese auto sales, anyone?). Most of it is backward-looking, but it still underscores the broader point: There is a big gap between this very benign economic reality and the -8.5% market drop that started the year.
Exhibit 1: Global Economic Data since 1/1/2016 (Click to Enlarge)
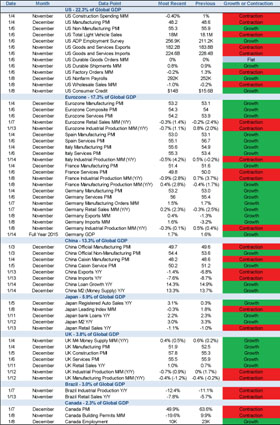
Source: FactSet, as of 1/14/2016.
This is not an exhaustive list. We've excluded countries that contribute little to global GDP, as well as data that don't reflect actual output, like inflation and consumer confidence surveys. The far-right column shows whether each data point rose or fell. But gauging global growth isn't as easy as tallying total positive and negative reports. Some reports, like eurozone service Purchasing Managers' Indexes (PMI), represent trillions of global output. Others, like UK construction, represent a much smaller slice of the global economy. And some data, like Chinese imports, are skewed by weak commodity prices in a year-over-year comparison. Moreover, some of the contractionary data show the tiniest of drops (PMIs slightly below 50 for example)[i], while much of the growth data suggest meaningful expansion (for example, PMIs in the mid 50s).
Though parts of the global economy are weak-Brazil, for example-most of the world is humming along just fine. Even China-ground zero for most global recession dread-grew 6.8% y/y in Q4 and 6.9% in 2015 overall. This is in stark contrast to the slew of deep recessionary fears accompanying stocks' slide. Nothing here suggests a global recession is forming.
Global recessions happen when huge swaths of the world decline-not just a handful of countries like Brazil and Russia. To get a net decline in global GDP, you'd need a few trillion in deleted economic activity, from major regions like the US and Europe. The data would also look far worse. In the 2008/2009 recession, the US non-manufacturing PMI bottomed at 37.6 in November 2008 while the manufacturing PMI hit 33.1 that December. Eurozone industrial production fell over -15% y/y for much of 2009.[ii] UK retail sales fell in 9 of 13 months from April 2008 through May 2009, including February 2009's -4.1% y/y slide.[iii] Today, these areas are growing, albeit with some internal pockets of weakness.
Leading indicators also tend to fall for some time before recessions strike. Today, forward-looking indicators point to more growth. The Conference Board's US and eurozone Leading Economic Indexes (LEI)-collectively accounting for almost half of global output-remain in long uptrends. No US recession in LEI's 57-year published history has begun with LEI high and rising.
All these data strongly suggest the global economy isn't deteriorating. Only investors' perception has deteriorated. Wildly detached sentiment can make stocks swing hard in the short term, but it also makes markets ripe for rebound once fear runs its course. It won't take much for results to keep beating low expectations, and that positive surprise is generally bullish. More downside could lurk in the short term, but the bull market seems far from over. Riding big short-term ups and downs isn't fun, but stocks should reward patience and discipline once the correction fades.
[i] PMIs (Purchasing Managers' Indexes) are surveys that measure the percentage of firms reporting growth. Readings above 50 suggest expansion while readings below 50 suggest contraction. But PMIs measure the breadth of growth, not the magnitude. So if the firms reporting growth are, on balance, growing at a faster pace than the remaining firms are contracting, PMIs below 50 may obscure actual growth.
[ii] Eurostat, as of 1/19/2016.
[iii] UK Office for National Statistics, as of 1/19/2016.
If you would like to contact the editors responsible for this article, please message MarketMinder directly.
*The content contained in this article represents only the opinions and viewpoints of the Fisher Investments editorial staff.
Get a weekly roundup of our market insights
Sign up for our weekly e-mail newsletter.

You Imagine Your Future. We Help You Get There.
Are you ready to start your journey to a better financial future?

Where Might the Market Go Next?
Confidently tackle the market’s ups and downs with independent research and analysis that tells you where we think stocks are headed—and why.
Related Resources
-
In The News Oil prices will be lower in 6 months than when Iran conflict began, Ken Fisher argues2026-03-12
-
Environmental, Social and Governance Insights Responsible Investment Newsletter 20262026-03-11
-
Market Analysis Rounding Up Odds and Ends From Global Energy Developments2026-03-11
-
Market Analysis Stablecoins Didn’t Eat the Treasury Bill Market2026-03-10


Learn More
Learn why 195,000 clients trust us to manage their money and how Fisher Investments and its affiliates may be able to help you achieve your financial goals.
As of 12/31/2025
New to Fisher? Call Us.
Contact Us Today