Personal Wealth Management /
A Q&A On Recent Volatility
Perspectives on the market’s recent pullback.

Fact: Volatility can be pretty, well, volatile sometimes. It’s also a normal, healthy feature of any bull market—dips and dives help keep sentiment in check. They keep fear alive, lowering expectations and extending the proverbial wall of worry. The market’s recent (and ongoing) gyrations are just normal—the price we pay for getting market-like long-term growth over time.
Most headlines won’t tell you this. In our daily survey of the more than 100 worldwide websites, pundits’ and economists’ blogs we cover, we’ve seen precious few (if any) outlets putting stocks’ recent ride in perspective. Some wonder when and whether technical indicators will tell us to brace for a bear. Others warn it’s 2000 all over again, with bursting bubbles in Biotech and social media about to take down the world. A handful look at sliding “momentum” stocks (whatever that means) and wonder whether they’ll rebound or another category will take their place atop the leaderboard. Most are written in such hyperbolic tone that you’d never know the S&P 500 was down only 3.9% since its April 2 peak as of Monday’s close. Or that for every person “dumping” formerly high-flying stocks, someone else is eagerly snapping them up.
Yes, having a little perspective can make all the difference. So without further ado, we give you the MarketMinder view on the current slide.
Is Biotech the new Tech Bubble? If so, are we all doomed?
Between the end of February 2011 and its peak on 2/25/2014, the Biotech component of the S&P 500 more than tripled. Over the same period, the broader index was up just over 40%, ergo those tech bubble comparisons. Whether it is or isn’t a bubble is in the eye of the beholder. Some select companies are trading at astronomical multiples of trailing revenues (and have yet to earn a profit), but these extreme cases aren’t the norm the way high-flying dotcoms were in 2000. The broader industry has experienced a fair amount of organic growth in recent years—unlike the dotcoms. It also happened to lag the S&P 500 heavily for this bull market’s first two years. (Exhibit 1)
Exhibit 1: S&P 500 Biotech Relative Return
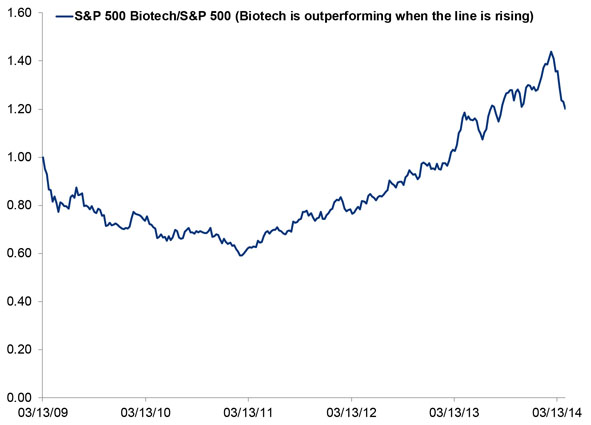
Source: FactSet, as of 4/14/2014
As for whether Biotech could take down the market, yes, in 2000, crashing Tech caused huge problems in both broader markets and the economy. But scale is critical. By December 31, 1999, Tech had swelled to comprise about 29% of the S&P 500 by market cap—big enough to cause major disruptions. Biotech? At its peak on February 25, Biotech was about 2.7% of the S&P 500. That’s up from 1.2% on 2/28/2011—and 2.4% when the bull began on 3/9/2009. A slide in Biotech is bad news for those who are over-concentrated (always diversify!), but it doesn’t have any fundamental reason to take down broader markets.
What are these “momentum” stocks I keep reading about?
In short, they’re a myth. Industry-speak generally describes them as stocks who’ve risen faster than the market’s average over the past year or more, theorizing these fast growers have enough oomph to keep outrunning markets.
Problem is, it’s a description based on past performance—past performance doesn’t dictate future returns. Nothing about a stock’s supposed momentum tells you where it goes from here. It just tells you what the stock has already done.
So when you read about “momentum” stocks crashing, it just means the high flyers are falling the hardest. Nothing predictive there—they aren’t leading indicators for the market. They’re just volatile stocks being volatile.
So, those stories claiming momentum is out and some other hot category is in are probably off base?
Yup, in our view, that’s all just noise. One theory says large-cap value will fill momentum’s void as stability-craving investors flock to high dividends—and the evidence supporting it amounts to strong recent returns for big value (yet another past performance argument). More specifically, they expect Energy and Consumer Staples to lead while Tech and Telecom lag, claiming that’s what usually happens when big value leads.
Look at actual fundamentals, though, and another outcome seems far more likely. Energy’s earnings have fallen over the past several quarters, thanks largely to the shale boom. That doesn’t seem likely to change any time soon, considering US natural gas prices remain near historic lows and oil prices aren’t running away. We’ve often noted the biggest stocks with the most stable earnings tend to do best later in bull markets, when earnings growth becomes more variable and investors have to compete more for that hot commodity. Looking ahead, we expect these mega-cap stocks—the biggest of the big—to assume leadership as the bull market matures.
Is it true we don’t have to worry until stocks cross below their long-term trend-line?
We’d strongly suggest not getting caught up in technical indicators—moving averages don’t tell you anything. We’ve seen the argument saying stocks should be ok as long as the market’s price level stays above its 200-day moving average, but this just isn’t predictive—it’s yet another past-based argument.
If moving averages were predictive, it would be a self-fulfilling prophecy. If stocks’ trading above their moving average really predicted strong returns to come, we’d never have another bear market ever—they’d always stay above the average, always signaling more bull. Same on the downside—as soon as the market fell below that supposed trend-line, it’d go to zero. But that just isn’t how markets work—cycles turn, and you can’t rely on technical analysis to tell you when that will happen.
Can stocks still do well in 2014?
With stocks now down year-to-date after a strong 2013, most pundits expect the market’s case of the blahs to continue.
But it’s perfectly normal for stocks to be flat or down for the first quarter or two (or three!), then rally hard. Returns come in clumps and bunches. In 2010, the MSCI World was down for the year when August finished but ended the year up 11.8%. In 2006, the index was flat as of mid-June, but it rallied and finished up 20.1%. 2004 was flat through mid-August but finished up 14.7%. Rare is the year that moves in a straight line.
Again, stocks don’t move on past performance. In the short term, they can swing hard on sentiment, but in the mid to longer term, stocks move most on the gap between fundamental reality and expectations. Expectations today are still on the low side—the latest evidence being all those who expect lackluster returns from here. But with a growing global economy, steepening yield curve, relatively low legislative risk in the US (and elsewhere in the developed world) and high and rising corporate profits and business investment, stocks should have plenty of reasons to keep on rising.
4 Ways to Avoid Running Out of Money During Retirement
To investors who want to retire comfortably. Download the guide by Forbes columnist and money manager Ken Fisher's firm. It's called "The 15-Minute Retirement Plan." Even if you have something else in place right now, it still makes sense to request your guide!
If you would like to contact the editors responsible for this article, please message MarketMinder directly.
*The content contained in this article represents only the opinions and viewpoints of the Fisher Investments editorial staff.
Get a weekly roundup of our market insights
Sign up for our weekly e-mail newsletter.

You Imagine Your Future. We Help You Get There.
Are you ready to start your journey to a better financial future?

Where Might the Market Go Next?
Confidently tackle the market’s ups and downs with independent research and analysis that tells you where we think stocks are headed—and why.
Related Resources
-
Politics Blunting Burnham?2026-07-21
-
Market Analysis Why the SOX “Bear Market” Isn’t Foreboding2026-07-21
-
Expert Commentary 3 Things You Need to Know This Week | Q2 Earnings, ECB Meeting, Trump Accounts
 2026-07-20
 -
Weekly Wrap-Up Fisher Investments Reviews: Last Week in Markets—July 13 - July 172026-07-20


Learn More
Learn why 210,000 clients trust us to manage their money and how Fisher Investments and its affiliates may be able to help you achieve your financial goals.
As of 6/30/2026
New to Fisher? Call Us.
Contact Us Today