Personal Wealth Management / Economics
A Word on August Retail Sales and Industrial Production
Contrary to what headlines portray, we don’t think these data reflect a teetering economic recovery.

This week, two US data releases fanned fears of a faltering recovery: August retail sales and industrial production. Both grew, but they slowed from their earlier fast pace, triggering fears the rebound is on life support. In our view, this is an example of overthinking typically volatile economic data. Instead of portending more economic woes ahead, we think these figures show the US recovery persists—and headlines’ reaction reflects dour sentiment, a bullish cocktail.
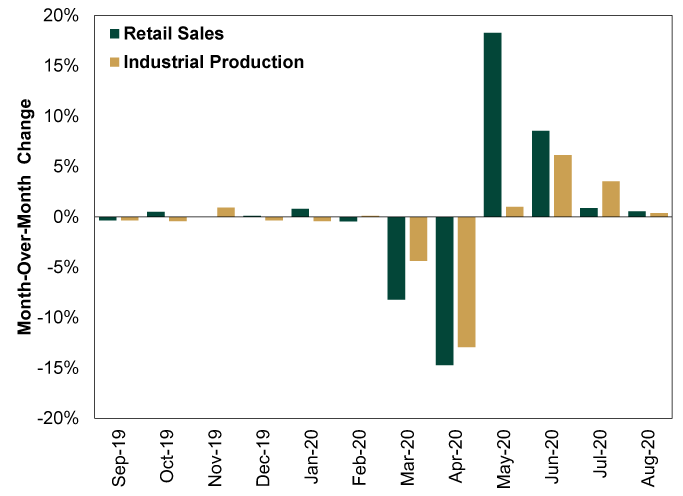
First, the data. Industrial production rose 0.4% m/m in August—the fourth straight month of growth, albeit slower than July’s hot 3.5% pace.[i] Meanwhile, August retail sales rose 0.6% m/m, slightly slower than July’s 0.9% and far below June’s 8.6% pace, much less May’s 18.3%.[ii] As Exhibit 1 shows, these series have swung wildly in recent months.
Exhibit 1: Monthly Industrial Production and Retail Sales Growth
Source: FactSet, as of 9/16/2020. Month-over-month change in US industrial production and retail sales volumes, September 2019 – August 2020.
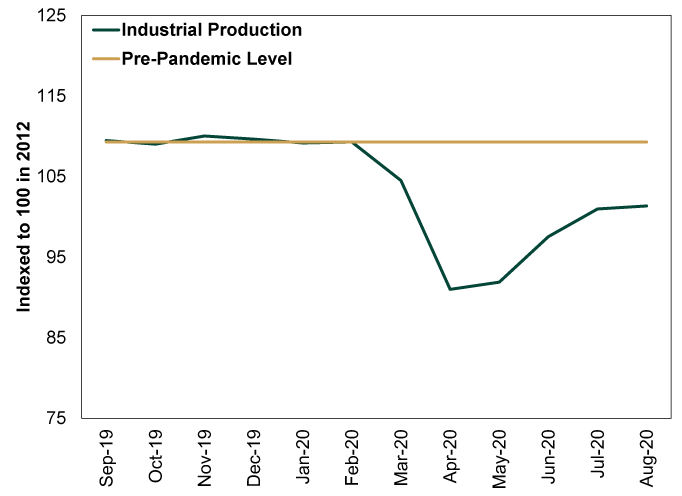
So yes: While both series showed growth, it was far slower than torrid midsummer rates. But we don’t think this means the recovery is on the rocks. For starters, both data series have rebounded considerably. Industrial production (shown in Exhibit 2) is -7.3% below pre-pandemic levels and -7.7% below a year ago.[iii] While this is a ways from breakeven, it is still up 11.4% from its April low.[iv] Moreover, part of the reason the early jumps were so large is that the calculation started from an extremely depressed, lockdown-driven base. Slowing is normal as that base rises—especially considering economies worldwide aren’t fully back to pre-pandemic openness.
Exhibit 2: Industrial Production Level
Source: FactSet, as of 9/16/2020. US industrial production, indexed to 100 in 2012, September 2019 – August 2020.
Retail sales show a similar but more nuanced story, in our view. Growth slowed, and we suspect the base effect factors into this too. But consider, also, where that base is today. Retail sales exceeded pre-pandemic levels in June.[v] Modest month-over-month growth off this now-higher base isn’t cause for alarm, in our view.
Exhibit 3: Retail Sales Level
Source: FactSet, as of 9/16/2020. US retail sales volumes, September 2019 – August 2020.
With that said, we think COVID restrictions’ varied impact on spending helps explain the discrepancy between how August retail sales and industrial production compare to their respective pre-pandemic levels. Businesses deemed “non-essential”—and therefore subject to stricter COVID restrictions, including closures—skew towards services. Think: bars and restaurants, hair salons, gyms and movie theaters. Others, like the travel industry, may have been open, but the pandemic directly hampers their business. Goods purveyors may also benefit from work-from-home trends and remote schooling. Hence, when lockdowns were at their harshest, many consumers seemingly shifted a chunk of their discretionary spending from inaccessible services to physical goods—stuff like electronics, home improvement goods and exercise equipment.
While retail sales includes food services sales, it misses most services spending—the lion’s share of consumer activity in the US. This narrowness means it captured the benefit to goods expenditures and understated the hit to services. But as gradually loosening restrictions let more services businesses reopen, consumers are likely rotating back toward services spending—likely a contributor to slower retail sales growth. We will get a sense of the degree of this when the government reports August personal consumption expenditures in early October.
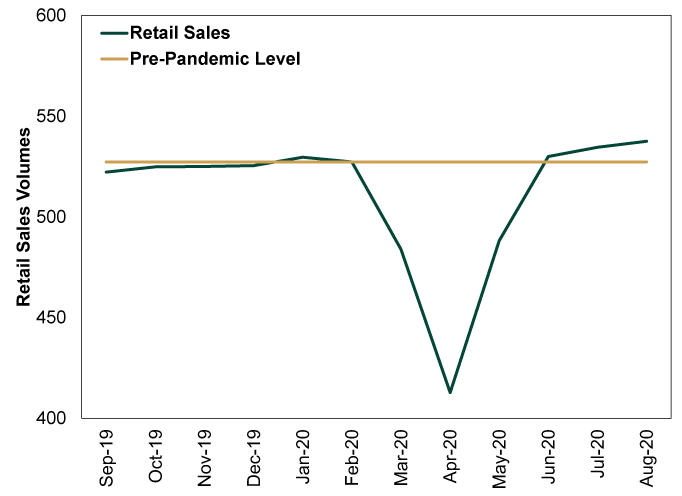
Exhibit 4: Industrial Production and Retail Sales Growth, March 2009 – February 2010
Source: FactSet, as of 9/16/2020. Month-over-month change in US industrial production and retail sales volumes, March 2009– February 2010.
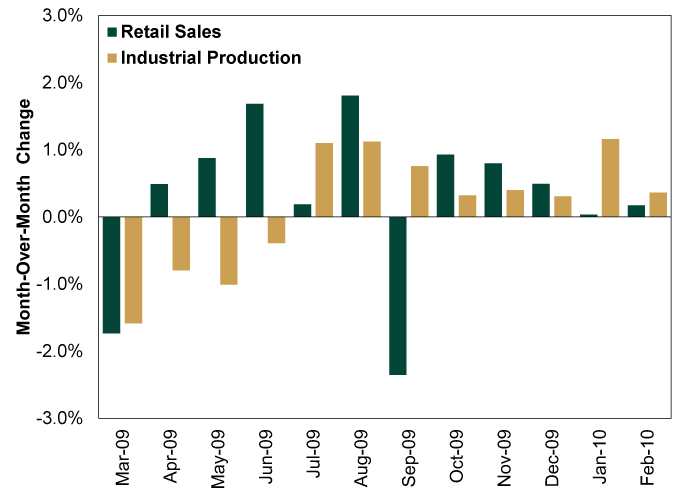
As Exhibit 4 shows, occasional month-to-month dips didn’t derail the economic recovery or bull market. Likewise, in our view, there is little in the recent deceleration to suggest this time is different. So while we suspect some people would benefit from a further government fiscal response, we really wouldn’t expect that to be a huge boon to these series’ growth rates. Their swiftest bounces are likely behind us now—especially retail sales, as more services reopen.
In our view, markets are well aware of the spending distortions COVID lockdowns wrought—including the gains of the “stuff economy” at the expense of the “services economy.” We doubt small wiggles in these series matter much to markets now, as stocks are likely focusing on the far end of the 3 – 30 window they typically weigh. In our view, all the negativity over monthly growth rate wobbles indicates the pessimism bull markets are born on remains rampant.[i] Source: FactSet, as of 9/16/2020.
[ii] Ibid.
[iii] Ibid. Percentage change in US industrial production, February 2020 – August 2020 and September 2019 – August 2020.
[iv] Ibid.
[v] Ibid. Percentage change in US retail sales, February 2020 – June 2020 and July 2019 – June 2020.
If you would like to contact the editors responsible for this article, please message MarketMinder directly.
*The content contained in this article represents only the opinions and viewpoints of the Fisher Investments editorial staff.
Get a weekly roundup of our market insights
Sign up for our weekly e-mail newsletter.

You Imagine Your Future. We Help You Get There.
Are you ready to start your journey to a better financial future?

Where Might the Market Go Next?
Confidently tackle the market’s ups and downs with independent research and analysis that tells you where we think stocks are headed—and why.
Related Resources
-
Economics Quick Hit: Durably Broad-Based Growth2026-07-29
-
Market Analysis On the Chop in the Oil Market2026-07-29
-
Politics Takaichi Raises Japan’s Wall of Worry2026-07-27
-
In The News Why Kevin Warsh should think twice about hiking interest rates — even as anxiety over the Iran war grows2026-07-27


Learn More
Learn why 210,000 clients trust us to manage their money and how Fisher Investments and its affiliates may be able to help you achieve your financial goals.
As of 6/30/2026
New to Fisher? Call Us.
Contact Us Today