Personal Wealth Management / Market Analysis
Big Theories, Small Moves
Pundits offer plenty of explanations for bond market volatility, but bond markets aren't very volatile by historical standards.

The range of opinions regarding what 2015's bond yield fluctuations mean is wide and volatile. The range of actual yield movement is much less so. This discrepancy is another reminder, dear investors, that before you buy into extrapolations of trends, narratives and plausible-sounding stories, it is wise to check the data.
Developed world bond rates started 2015 by plunging. In the year's first 22 trading sessions, 10-year US Treasury yields fell by -0.53 percentage point (-53 basis points, bps), dropping from 2.17% to 1.64%.[i] In the same period, UK 10-year rates fell -42 bps.[ii] German yields? -27 bps.[iii] Even Japanese yields ticked slightly lower.
That yields fell steeply during a rather rocky month for global stocks led some to surmise trouble was brewing in the global economy. Falling yields were deemed "alarming," with many suggesting there was no end in sight to the drop. Others claimed they signaled looming global deflation, with many fearing falling prices would suck global economic growth into a contractionary vortex where consumers cease spending awaiting falling prices, only to cause them to fall more. The New York Times suggested the "fierce rally" in "a huge bond market with a strong track record for predicting economic problems is flashing a warning sign." Still others deployed a slew of bullet points supporting the notion this decline in yields had a wide range of rather grandiose causes. Well-known bond gurus suggested the long-running bond bull was alive and well.
After all these extrapolations and quests to identify deeper meaning in short-term swings, what came next characterized markets' often counterintuitive moves: Yields shot up. US rates rose 65 bps between their January 30 low and their recent high, 2.29% on May 13.[iv] UK rates rose 70 bps. Japanese rates rose 24 bps. German yields, in what some have dubbed a "bund tantrum", rose 65 basis points.[v] And with no sense of irony, pundits near immediately began a quest for meaning in those rising bond yields. Some suggested the spiking rates threatened markets and the economy. Others theorized the spike was due to a lack of liquidity in the bond market. Or inflation worries. A well-known bond guru extrapolated the month-or-so-long rise into the distant future and suggested the long-term downtrend in bond yields was over and a new bond bear had arrived. Others collected a sampling of random ideas and listed them. So many contradictory theories in so little time!
Yet US 10-year Treasury rates closed Thursday at 2.14%.[vi] Yep, those of you keeping score at home are correct-that is a year-to-date decline of a mere 3 bps. 0.03 percentage point. In MarketMinder-speak, "flat." Japanese yields are up, but only by 5 bps. UK rates are up 13 basis points. German yields are the flattest of them all-up a measly 1.6 basis points year-to-date.
Seem like a lot of volatility to get you basically nowhere? It isn't. By historical standards, 2015's rate moves are below average. Exhibits 1 - 4 show the first five months' maximum change in US, UK, German and Japanese 10-year yields, sorted by magnitude of move. As you can see, through five months, 2015 doesn't appear to be wildly volatile. It seems pretty typical, if not tame.
Exhibit 1: US Maximum 10-Year Rate Change (in Percentage Points) Through May
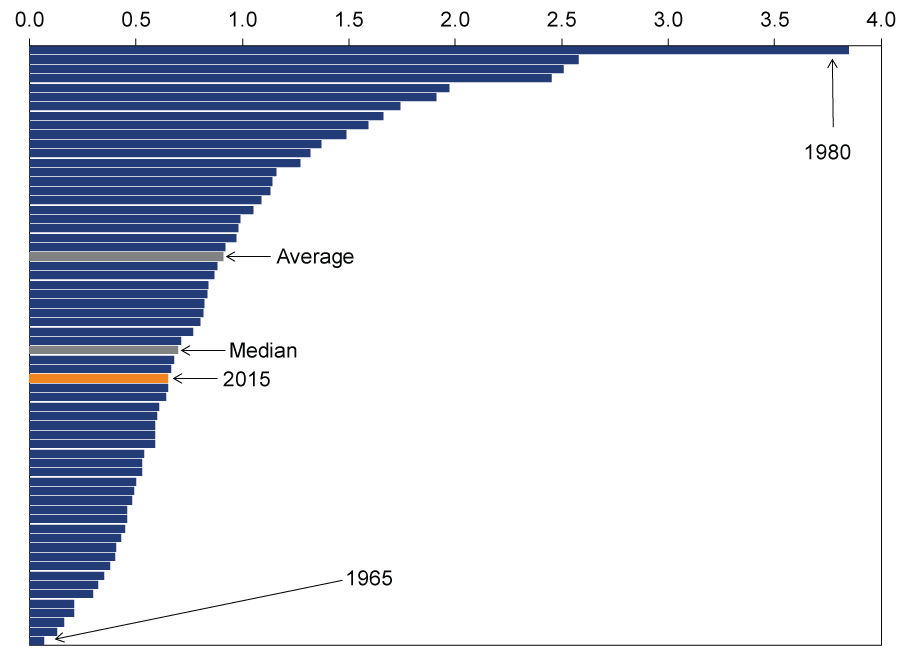
Source: FactSet, as of 5/28/2015. 12/31/1953 - 5/27/2015.
Exhibit 2:UK Maximum 10-Year Rate Change (in Percentage Points) Through May
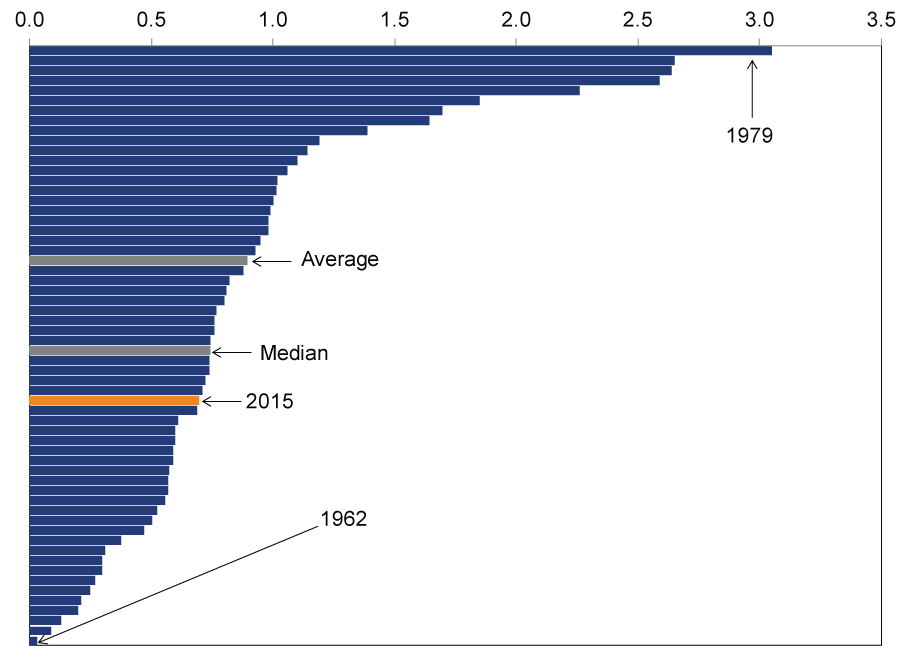
Source: Global Financial Data, Inc., as of 5/28/2015. 12/31/1958 - 5/27/2015. Data are monthly through January 1979 and daily thereafter.
Exhibit 3: GermanyMaximum 10-Year Rate Change (in Percentage Points) Through May
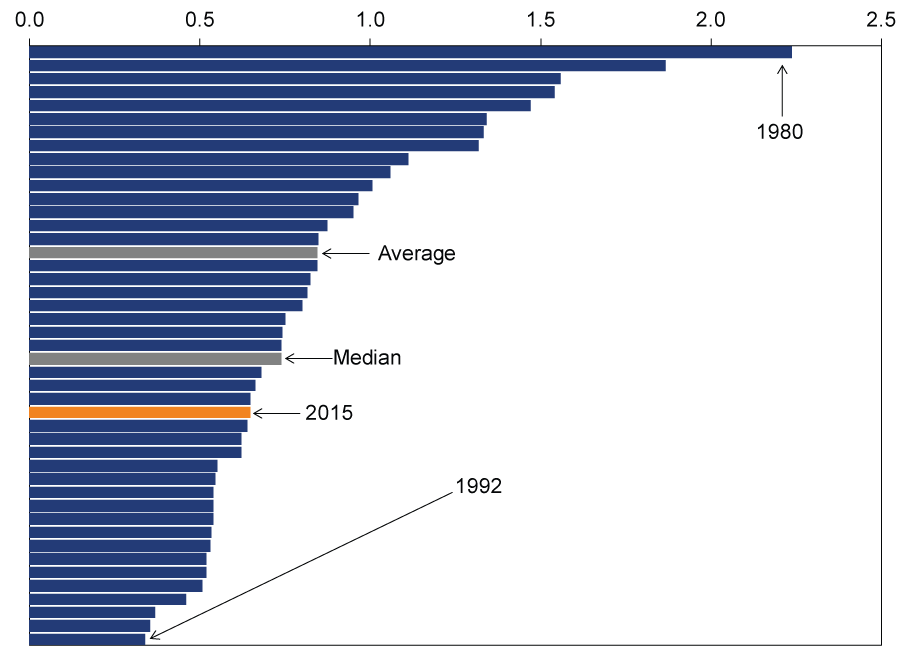
Source: FactSet, as of 5/28/2015. 12/31/1972 - 5/27/2015. Data prior to German reunification are based on West German yields.
Exhibit 4: JapanMaximum 10-Year Rate Change (in Percentage Points) Through May
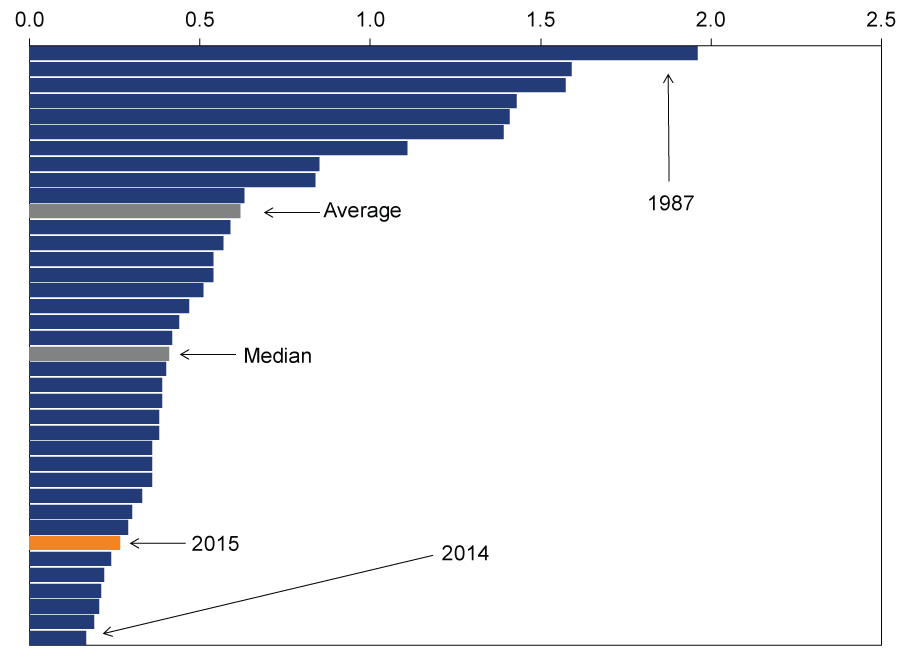
Source: Global Financial Data, Inc., as of 5/28/2015. 12/31/1980 - 5/27/2015. Data from January 1980 through September 1982 are monthly, daily thereafter.
Now, if you measure these moves as a percentage change (as some have), they'll look huge. After all, going from 0.075% to 0.723%, as German yields did, is a roughly 10-fold increase. But consider, rates going from 0.01% to 0.02% is a 100% change, but either way, they are still extremely low. It makes no economic sense to measure rate changes this way, as borrowers and creditors are going to think in terms of what the price of money actually is and what it might be.
To us, the back-and-forth-to-end-flat first five months is pretty much how we expect interest rates to behave this year. On the one hand, expansionary global economic data and improved labor market conditions favor higher rates. On the other, foreign central bank actions, low inflation expectations and high bank demand for bonds drag them back down, to finish little changed. Along the way, we expect a tug-of-war between the two camps. We'd merely suggest caution in drawing big conclusions based on which side is tugging harder presently. Bond markets are no more rational in the short term than any other market. Reading a lot into wiggles can easily mislead.
[i] Source: FactSet, as of 5/28/2015.
[ii] Ibid. (That means same source.)
[iii] Ibid.
[iv] Ibid.
[v] Bunds are the technical name of German sovereign bonds. "Bund Tantrum" is an effort to give a similar moniker to this move as many gave to US rates' rise after former Fed head Ben Bernanke first publicly raised the possibility of slowing quantitative easing bond purchases-the "Taper Tantrum." We hope this new one doesn't stick.
[vi] See Note 1.
If you would like to contact the editors responsible for this article, please message MarketMinder directly.
*The content contained in this article represents only the opinions and viewpoints of the Fisher Investments editorial staff.
Get a weekly roundup of our market insights
Sign up for our weekly e-mail newsletter.

You Imagine Your Future. We Help You Get There.
Are you ready to start your journey to a better financial future?

Where Might the Market Go Next?
Confidently tackle the market’s ups and downs with independent research and analysis that tells you where we think stocks are headed—and why.
Related Resources
-
Expert Commentary This Week in Review | Market Volatility, Energy Markets, US Inflation
 2026-03-13
 -
Market Analysis Due Diligence and the DOL’s DOA Fiduciary Rule2026-03-13
-
In The News Oil prices will be lower in 6 months than when Iran conflict began, Ken Fisher argues2026-03-12
-
Market Analysis Rounding Up Odds and Ends From Global Energy Developments2026-03-11


Learn More
Learn why 195,000 clients trust us to manage their money and how Fisher Investments and its affiliates may be able to help you achieve your financial goals.
As of 12/31/2025
New to Fisher? Call Us.
Contact Us Today