Personal Wealth Management / Politics
Blue? Red? For Stocks, Election Years Are Typically Green
Falling uncertainty as elections approach tends to boost stock market returns.

Photo by Tetra Images/Getty Images
Well, there you have it: Ringling Brothers' quadrennial political circus is over! The Republican and Democratic Party conventions are done and dusted, and the Green Party's Jill Stein and Libertarian Party's Gary Johnson finally have fellow nominees: One Donald J. Trump for the GOP, and one Hillary R. Clinton for the Democrats. Let the fun commence! And we say "fun" not because we enjoy mudslinging, truth-twisting and other campaign trail dark arts. Rather, because the general election campaign's advent ushers in a typically bullish time-particularly for US stocks.
The fourth year of a president's term tends to be good for US stocks. While campaign theatrics steal headlines, the parts of the political scene that more directly impact stocks-namely, Congress-are quiet. When politicians are busy stumping for votes and kissing babies, they don't pass laws. That reduces legislative risk, keeping stocks happy. Hence one reason why returns are positive 82% of the time, with average gains of 11.1%-above US stocks' long-term average 73% frequency of positive returns and 9.9% annual return.[i] Some say markets do poorly in the eighth year of a president's term, but this is based on a limited (and occasionally oddly selected) data set and heavily skewed by 2008. The market didn't tank in 2008 because it was the final year of a president's second term. It fell for completely unrelated reasons.
Much of the fun comes in late summer and early autumn, as stocks discount the election's outcome. Stocks are forward-looking-they don't wait for your favorite news anchor to read the results on election night. They start pricing in the results months in advance, discounting all the polls, analyses, debates, opinions, pledges and "don't worry this is what they'll really do" from campaign surrogates. It all improves clarity, which markets appreciate. The closer the contest gets, the better markets know the eventual winner-and the more they like that person. Even if they feared them earlier on, by the end, they're often cool with it. And if they liked them before, well, then they like them that much more. Hence election-year returns tend to be back-end loaded, with US stocks outperforming as the vote nears. (Exhibit 1)
Exhibit 1: US Stocks Outperform in Election Year Second Halves
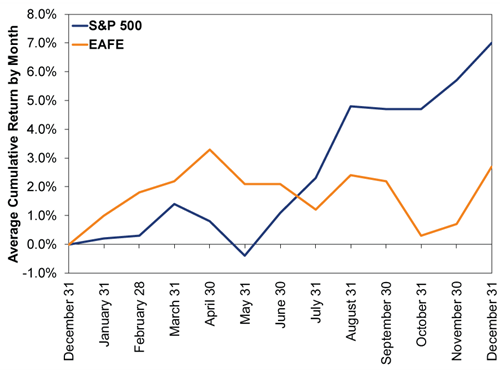
Source: Global Financial Data, Inc., as of 2/4/2016. Average monthly S&P 500 and EAFE price returns in election years from January 1928 - December 2012.
As for what stocks do after the vote, market returns in presidential election and inaugural years typically follow a trend we call the "Perverse Inverse." When a Republican wins, stocks typically do great in the election year, as pro-business campaign rhetoric whips up happy sentiment. But in the inaugural years, returns tend to be muted as the new president moderates and disappoints those lofty expectations. Conversely, when Democrats win, stocks usually post below-average returns in the election year as investors fear anti-business campaign pledges, then achieve above-average returns the following year as the Democratic president also moderates, exceeding investors' low expectations. (Exhibit 2)
Exhibit 2: The Perverse Inverse

Source: Global Financial Data, Inc., as of 8/1/2016. S&P 500 total returns, 1926 - 2014.
Therefore, if Trump wins, history implies a great finish to 2016, with a more modest 2017. If Clinton wins, the political cycle argues for a modest finish to 2016 and a strong 2017. Now, many of Trump's proposed polices aren't exactly pro-business in a traditional sense, and unlike all other Democratic Presidents in the postwar era, Clinton is a known quantity. Both factors may influence whether or not the Perverse Inverse holds this time. Patterns always hold until they don't. Plus, the entire campaign has been such an angst-ridden circus that just knowing the outcome should be a relief for markets.
Over the next three months and seven days, campaign hijinks will hog front pages and cable news 24/7, with wacky soundbites and other such noise. Some you will cheer, some you will jeer or fear, but don't let the hype distract you. For stocks, all that matters is this: The wild what-ifs that bogged down sentiment over the past year are now in the rearview. Markets can finally focus on a standard contest, get to know the candidates, and start discounting the next administration.
[i] Source: Global Financial Data, as of 8/1/2016. Average cumulative S&P 500 total return in election years since 1928. Average S&P 500 annual total returns and frequency of positive calendar-year returns, 1/1/1926 - 12/31/2015.
If you would like to contact the editors responsible for this article, please message MarketMinder directly.
*The content contained in this article represents only the opinions and viewpoints of the Fisher Investments editorial staff.
Get a weekly roundup of our market insights
Sign up for our weekly e-mail newsletter.

You Imagine Your Future. We Help You Get There.
Are you ready to start your journey to a better financial future?

Where Might the Market Go Next?
Confidently tackle the market’s ups and downs with independent research and analysis that tells you where we think stocks are headed—and why.
Related Resources
-
Market Insights Ken Fisher on Inflation, Sell America, US National Debt and More - June 20262026-06-01
-
Expert Commentary 3 Things You Need to Know This Week | Global PMIs, US Jobs, Estate Planning
 2026-06-01
 -
Weekly Wrap-Up Fisher Investments Reviews: Last Week in Markets—May 25 - May 292026-06-01
-
Market Analysis On Canada’s “Technical” Recession2026-06-01


Learn More
Learn why 200,000 clients trust us to manage their money and how Fisher Investments and its affiliates may be able to help you achieve your financial goals.
As of 3/31/2026
New to Fisher? Call Us.
Contact Us Today