Personal Wealth Management / Market Volatility
Chart of the Day: Fund Flows and Capitulation
In December, investors fled stock mutual funds at their fastest pace since March 2009—the bottom of the last bear market.

Whether stocks are in a correction or bear market, the downturn’s final throes usually have a few common features. Often, they are steep, with end-of-the-world type stories everywhere in financial media. That backdrop, combined with seemingly erratic daily index movement, spooks investors out of the market. To use a bit of jargon, they capitulate to negativity and throw in the towel. Usually, that exodus happens very near the bottom.
Stock mutual fund flows are one, albeit imperfect, way to see this. They aren’t airtight, as they show you only one half of a decision. We can see people selling mutual funds, but we can’t see what they did with the proceeds. For this reason, run-of-the-mill fund outflows tell you very little about market sentiment. However, extremes can. And in December, extreme they were. Stock mutual fund outflows as a percentage of funds’ assets under management were on par with outflows in March 2009—the bottom of the bear market that accompanied the Global Financial Crisis. The only larger months were September 2001 (the 9/11 attacks), July 2002 (when Sarbanes-Oxley passed) and September and October 2008 (Lehman Brothers’ bankruptcy and the Fed and Treasury’s subsequent dismantling of Wall Street).
In other words, retail investors were acting like this is a major bear market or financial crisis. Yet that sentiment isn’t at all consistent with the economic landscape. Unlike 2001, 2008 and 2009, there is no recession—and there is little sign one lurks, based on the US Leading Economic Index’s continued long uptrend. Major, disruptive legislation on par with Sarbanes-Oxley isn’t on the horizon—a government that is one day from achieving history’s longest shutdown isn’t exactly the type to agree on sweeping change. Meanwhile, as of Thursday’s close, the S&P 500 was more than 10% above its Christmas Eve low, whipsawing those who capitulated.[i] Short-term volatility is impossible to predict, and it is possible some new scare story could send stocks careening back down for a bit. But absent that, it seems to us that spiking fund flows once again signaled a good time to buy, rather than a good time to sell.
Exhibit 1: Monthly Equity Mutual Fund Net Flows as a Percentage of Total Equity Mutual Fund Assets Under Management
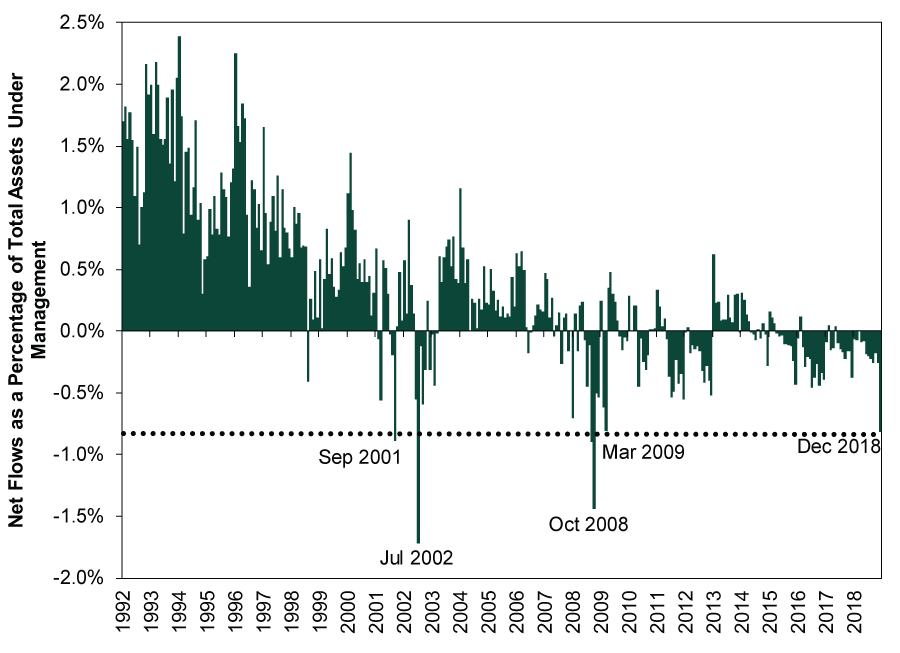
Source: FactSet and Thomson Reuters, as of 1/10/2018. Monthly ICI Equity Mutual Fund Net New Cash Flows and Monthly ICI Equity Mutual Fund Total Asset Values, 12/31/1991 – 11/30/2018; December 2018 net flows calculated using weekly ICI Equity Mutual Fund Net New Cash Flow estimates through 12/28/2018.
If you would like to contact the editors responsible for this article, please message MarketMinder directly.
*The content contained in this article represents only the opinions and viewpoints of the Fisher Investments editorial staff.
Get a weekly roundup of our market insights
Sign up for our weekly e-mail newsletter.

You Imagine Your Future. We Help You Get There.
Are you ready to start your journey to a better financial future?

Where Might the Market Go Next?
Confidently tackle the market’s ups and downs with independent research and analysis that tells you where we think stocks are headed—and why.
Related Resources
-
Market Analysis Declaring Fed Independence Fears False2026-07-01
-
Market Analysis Reader Mailbag: June 20262026-06-30
-
Market Analysis Investors Are (Still) Fighting the Last War on Inflation2026-06-30
-
Market Insights Ken Fisher on Crypto, Inflation, Annuities and More - June 20262026-06-30


Learn More
Learn why 200,000 clients trust us to manage their money and how Fisher Investments and its affiliates may be able to help you achieve your financial goals.
As of 3/31/2026
New to Fisher? Call Us.
Contact Us Today