Personal Wealth Management / Interesting Market History
Charts of the Week: Talkin’ Taxes
A look at history to put potential tax rate talk in context.

With 2019 winding down and an election year looming, you can rest assured that you will hear a lot about taxes in the near future. In some ways, you already are—many of the Democratic candidates vying to challenge President Donald Trump next year have tax plans, mostly involving hikes on the highest earners or wealthy.[i] Trump will likely have something to say about those plans—and potentially additional tax plans of his own, to build on 2017’s Tax Cuts and Jobs Act. This is politicians’ election year stock and trade. Debate over rates spurs emotion, with pundits often making sweeping claims about this or that proposal’s effects. However, a historical look at government tax revenue’s share of GDP shows debating rates can be very superficial.
Exhibit 1: Federal Government Tax Revenue by Category, Percent of GDP
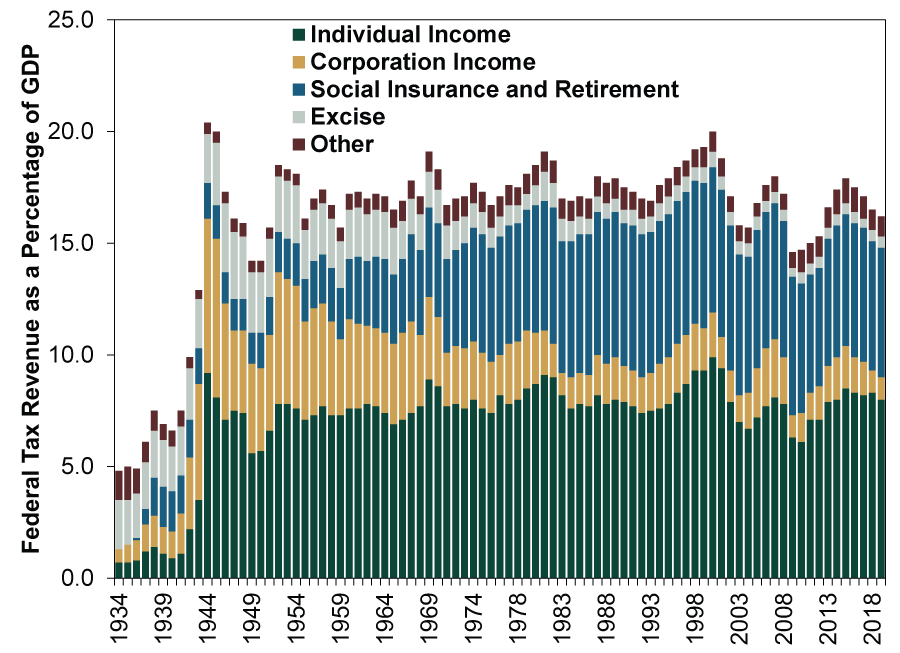
Source: White House Office of Management and Budget, as of 11/14/2019. 1934 – 2019 (estimated).
Of course, there was a large shift in the early years, as income taxes weren’t enacted until 1913, gradually hitting wider swaths of the public at higher rates. But once WWII’s big expenditures came—and America’s social safety net grew under Medicare and Social Security—tax revenue’s share of GDP has been remarkably stable.
This observation isn’t uniquely ours, of course. In the early 1990s, investment analyst and scholar W. Kurt Hauser observed that total tax revenue hovered around 19.5% of GDP throughout history.[ii] That comes despite top tax brackets ranging as high as 92% in the early 1950s to as low as 28% in the late 1980s.[iii] Pundits dubbed this stability, “Hauser’s Law.” Now, we won’t go so far as to subscribe to this “law” outright—there are fluctuations in the chart above. But still, those fluctuations are generally smaller than most seemingly presume—and just below Hauser’s observed level.
Personal income taxes are even more stable—making Hauser’s point more clearly. Exhibit 2 strips this out in line graph form, highlighting 1953, a year with 92% top tax rates, and 1990, when top marginal rates were at 28%. The two years are only 0.1 percentage point apart! Moreover, despite top-rate volatility, the government’s take from personal taxes has hovered around 8% of GDP with remarkable consistency. In 60 of 74 complete years postwar—or 81%—personal income taxes ranged between 7% and 9% of GDP.[iv]
Exhibit 2: The Government’s Take From Personal Taxes Is Remarkably Steady
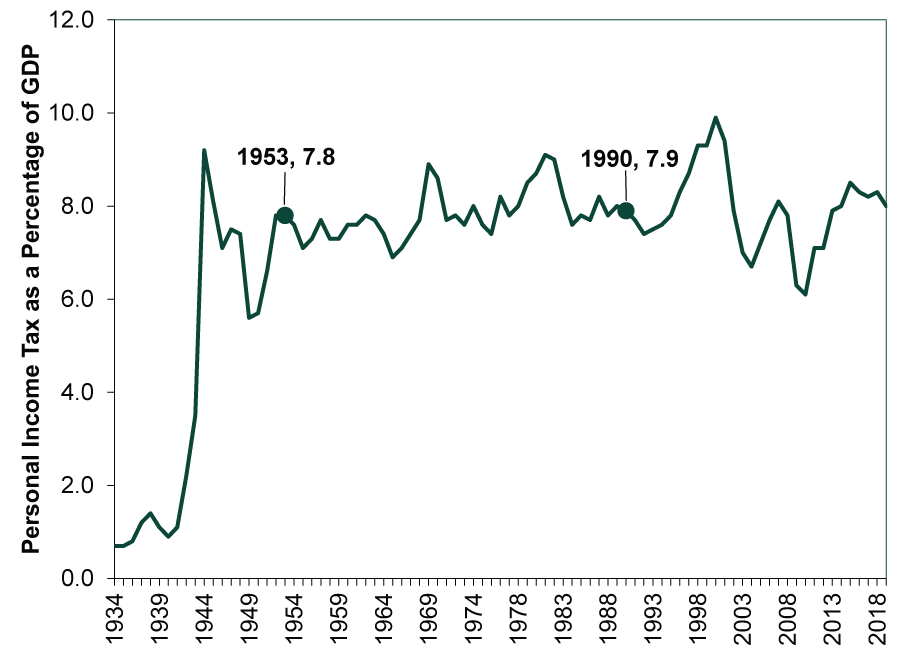
Source: White House Office of Management and Budget, as of 11/14/2019. 1934 – 2019 (estimated).
We figure this stability is largely attributable to a few things: One, tax rate analysis omits discussion of the tax base. That is far harder to quantify, as tax loopholes and breaks for selected activities have morphed and mushroomed over time. In addition, higher tax rates theoretically spur tax avoidance. Many, particularly those at the highest income and wealth levels, have unusual flexibility in terms of when to take income—and in what form. Others may not choose to work as much if it bumps them to a higher bracket.
It is far too early now to assess the potential likelihood of any candidate’s tax plan coming to fruition. We don’t know who the Democratic nominee will be, and no one has any realistic sense of how Congress will look. But when the debate heats up, remember: Tax rates aren’t the only factor that matters—and don’t overrate the effect.
[i] These two terms aren’t synonymous, although we often see coverage of them as though they are.
[ii] Sources: “There’s No Escaping Hauser’s Law,” W. Kurt Hauser, The Wall Street Journal, 11/26/2010, https://www.wsj.com/articles/SB10001424052748703514904575602943209741952.
[iii] “Historical Highest Marginal Income Tax Rates,” Tax Policy Center, as updated 1/18/2019. https://www.taxpolicycenter.org/statistics/historical-highest-marginal-income-tax-rates
[iv] Source: White House Office of Management and Budget, as of 11/14/2019.
If you would like to contact the editors responsible for this article, please message MarketMinder directly.
*The content contained in this article represents only the opinions and viewpoints of the Fisher Investments editorial staff.
Get a weekly roundup of our market insights
Sign up for our weekly e-mail newsletter.

You Imagine Your Future. We Help You Get There.
Are you ready to start your journey to a better financial future?

Where Might the Market Go Next?
Confidently tackle the market’s ups and downs with independent research and analysis that tells you where we think stocks are headed—and why.
Related Resources
-
Market Analysis Why “War Winner” Trades Are Off Base2026-03-20
-
Expert Commentary This Week in Review | Energy Markets, Fed Meeting, Earnings Reporting
 2026-03-20
 -
Market Analysis Around the World in Central Banking, Iran War Edition2026-03-19
-
Politics Beyond the War: A Political Roundup Covering America, Canada and Denmark2026-03-17


Learn More
Learn why 195,000 clients trust us to manage their money and how Fisher Investments and its affiliates may be able to help you achieve your financial goals.
As of 12/31/2025
New to Fisher? Call Us.
Contact Us Today